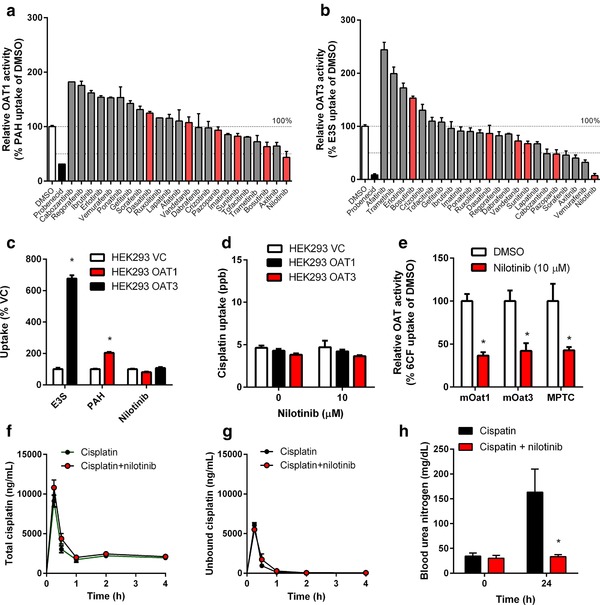
Figure 5.

Inhibition of OAT1 and OAT3 function by nilotinib. Inhibition of OAT1 (a) and OAT3 (b) function by tyrosine‐kinase inhibitors (TKIs) in vitro (10 μM; 15‐min preincubation), using p‐aminohippurate (PAH) and estrone‐3‐sulfate (E3S) as OAT1 and OAT3 substrates in transfected HEK293 cells. Data (n = 6–9 per group) were normalized to substrate uptake in the absence of TKIs, and probenecid was used as a positive control inhibitor. TKIs with known OCT2‐inhibitory potential are shown in red. (c) Uptake of PAH (5 μM; 15‐min uptake) and E3S (1 μM; 15‐min uptake) by HEK293 cells overexpressing OAT1 and OAT3, respectively, and lack of uptake of nilotinib (1 μM; 15‐min uptake) by OAT1 or OAT3. Data (n = 6 per group) were normalized to substrate uptake in cells transfected with an empty vector (VC). (d) Lack of cisplatin uptake (500 μM; 60‐min uptake) by OAT1 or OAT3 in transfected HEK293 cells, with or without nilotinib (10 μM; 15‐min preincubation). (e) Inhibition of mouse Oat1 (mOat1) and mOat3 function in transfected HEK293 cells in vitro, and of organic anion transport function in mouse proximal tubular cells (MPTC) from FVB (wildtype mice) ex vivo by nilotinib (10 μM; 15‐min preincubation), using 6‐carboxyfluorescein (6CF) as a substrate. Data (n = 6 per group) were normalized to substrate uptake in the absence of nilotinib. (f, g) Plasma concentration–time curves for total cisplatin (f) or unbound cisplatin (g) after cisplatin (15 mg/kg) with or without pretreatment with nilotinib (150 mg/kg; p.o.) in DBA/lacJ (wildtype) mice. (h) Levels of blood urea nitrogen in Oct1/2(–/–) mice after cisplatin (15 mg/kg) with or without nilotinib pre‐treatment (15 mg/kg; p.o.). All data represent mean values (bars or symbols) and SD (error bars), and the star (*) indicates P < 0.05 vs. the respective control group.
