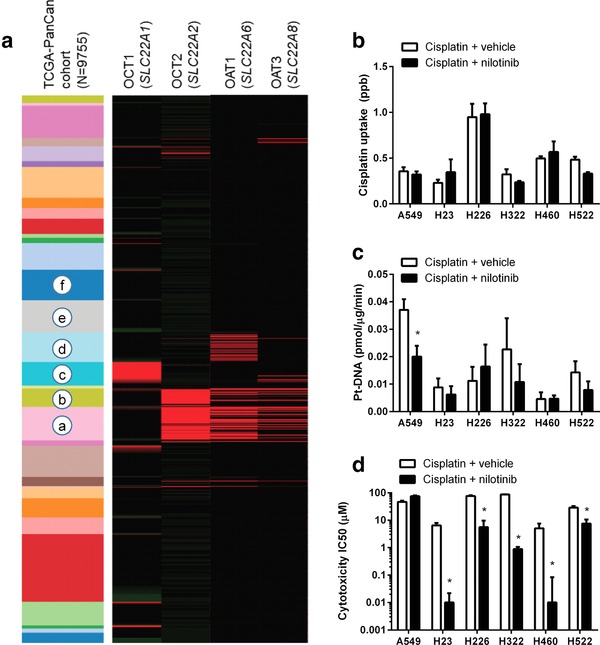
Figure 6.

Nilotinib does not antagonize cisplatin‐mediated cell death. (a) Expression of the transporter genes SLC22A1 (OCT1), SLC22A2 (OCT2), SLC22A6 (OAT1), and SLC22A8 (OAT3) in 9,755 human tumor specimens using normalized RNAseq data from 31 individual pan‐cancer (PANCAN) cohorts from The Cancer Genome Atlas (TCGA). The expression values were normalized across cancer types, where the red color represents high gene expression values. The cohorts shown (top to bottom) include: thymoma, uterine carcinosarcoma, thyroid cancer, testicular cancer, sarcoma, rectal cancer, prostate cancer, pheochromocytoma, pancreatic cancer, ovarian cancer, ocular melanoma, mesothelioma, melanoma, lung cancer (squamous), lung cancer (adeno), glioma, liver cancer, large B‐cell lymphoma, kidney cancer (papillary), kidney cancer (clear cell), kidney chromophobe, head and neck cancer, glioblastoma, endometroid cancer, colon cancer, cervical cancer, breast cancer, bladder cancer, bile‐duct cancer, adrenocortical cancer, and acute myeloid leukemia. The highlighted cohorts include: a, kidney (clear cell); b, kidney (papillary); c, liver; d, glioma; e, non‐small cell lung cancer (NSCLC; adeno); and f, NSCLC (squamous). (b–d) Influence of nilotinib (10 μM; 15‐min preincubation) on the uptake (b), nuclear platination (Pt‐DNA) levels (c), and cytotoxicity (d) of cisplatin in the replicating NSCLC cell lines A549, H23, H226, H322, H460, and H522. Data (n = 4–16 per group) represent mean (bars) and SD (error bars), and the star (*) represents P < 0.05 vs. the respective control group.
