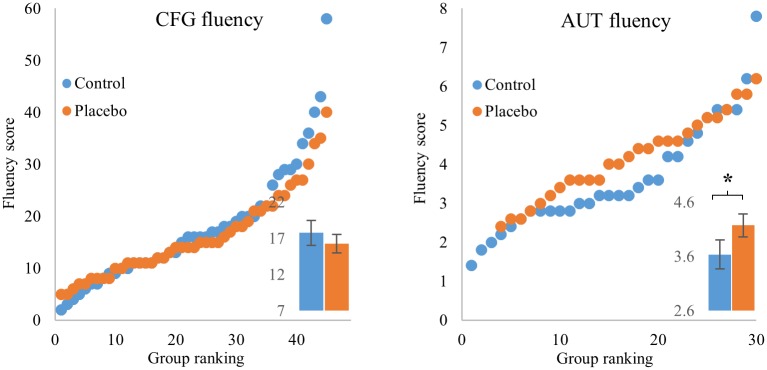
Fig 3. The placebo group showed a trend for higher fluency in the AUT (right) and no such difference in the CFG (left).
Scatterplots of fluency scores of the placebo (orange) and control (blue) groups. Y axis is fluency scores, ranked from lowest to highest. X axis is group ranking (in the AUT since number of participants in the placebo group was smaller by 3, matching is from the highest score onwards). Insets show mean fluency in each group, error bars are standard error of the mean. † p value < 0.06.

