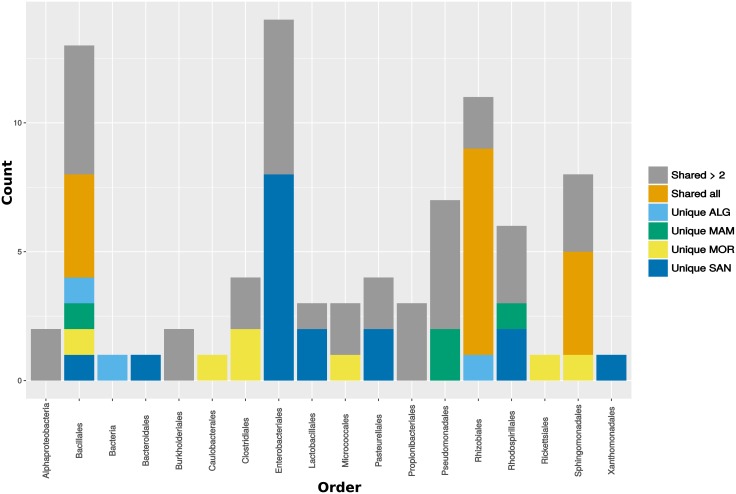
Fig 6. Barplot showing the distribution of unique bacterial OTUs (y axis) in G samples.
On the x axis, bacterial orders are reported. Gray bars indicate the number of OTUs belonging to a specific Order shared by more than two localities. Orange bars indicate how many OTUs are shared among all four sampling localities. The other colors indicate the number of unique OTUs belonging to different orders.

