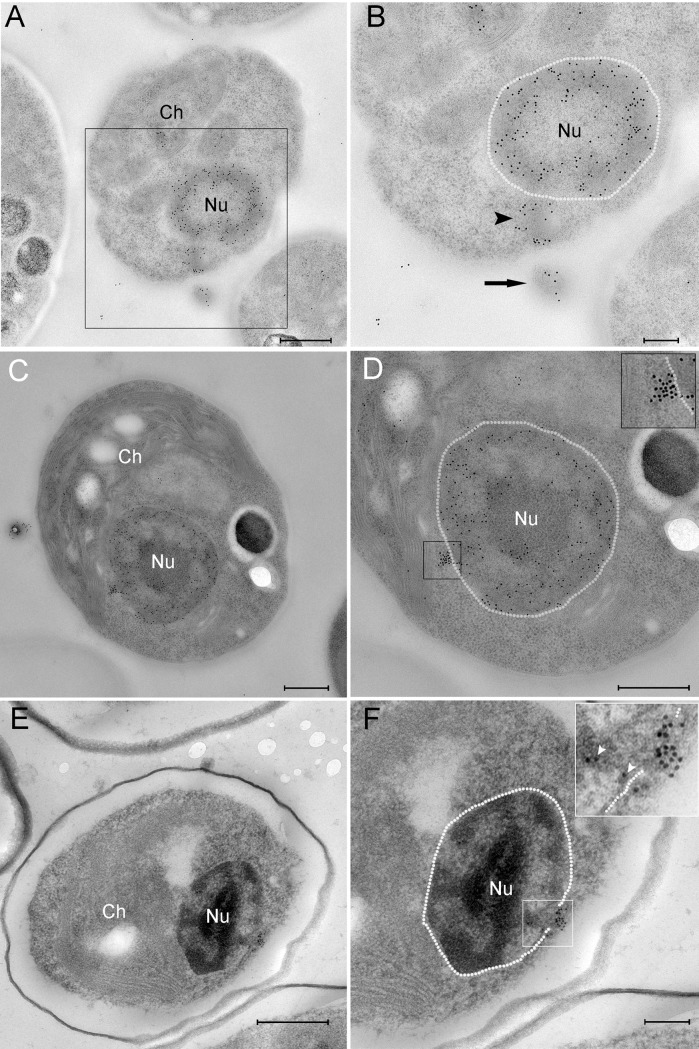
Fig 3. PBCV-1 genomes are transported towards the host nucleus.
A-D. Cells infected with PBCV-1 for 2–6 min, immobilized using HPF-FS and thin sections were immuno-labeled with anti-DNA antibodies. A. Low magnification view of an infected cell. B. High magnification of the region indicated in panel A revealing a partially empty capsid (arrow) in the process of DNA ejection and translocation to the nucleus (arrowhead; nucleus contour is delineated with a dashed white line). Note that the viral DNA bypasses cytoplasmic barriers. C. Low magnification of a cell that was infected with PBCV-1 exhibiting dense DNA labeling close to the nucleus. D. High magnification of the cell in panel C. The dense and clustered DNA labeling near the nucleus strongly implies a condensed viral DNA morphology. Inset shows high magnification of the cytoplasmic DNA (nucleus borders are delineated with a dashed line). E, F. Cells were infected with PBCV-1 for 6 min and then chemically fixed and thin sections were subjected to EMISH. E. Low magnification of a cell illustrating dense viral DNA near the nucleus. F. High magnification view of panel E. Note that viral DNA is on a possible entry into the nucleus (white arrowheads in the inset). Nucleus contour is delineated with white dashed line. Nu: nucleus, Ch: chloroplast. Scale bars: A, C, D, E: 500 nm; B, F: 200 nm.

