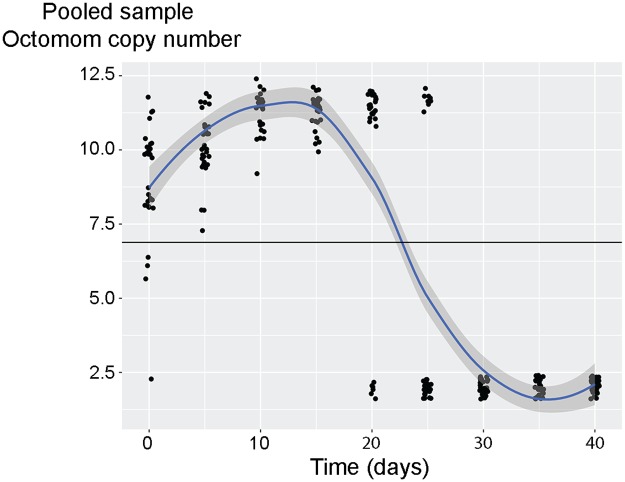
Fig 1. Simulation of Octomom copy number variation over time for 30 samples of five flies from a heterogeneous population.
This simulation is based on an initial population constituted of 50% flies carrying wMelPop with two Octomom copies and 50% flies carrying wMelPop with twelve Octomom copies. Wolbachia levels data used for this simulation are published as Fig. 3C (Dataset S6) and survival data as Fig. S5G (Dataset S4) in [4]. Both datasets include flies raised and kept at 25°C. The script (S1 Text) and data (S1 and S2 Datasets) for the simulation are provided as supplementary data. The black line indicates the average Octomom copy number of all the simulated samples. The smooth conditional mean is included for illustrative purposes.

