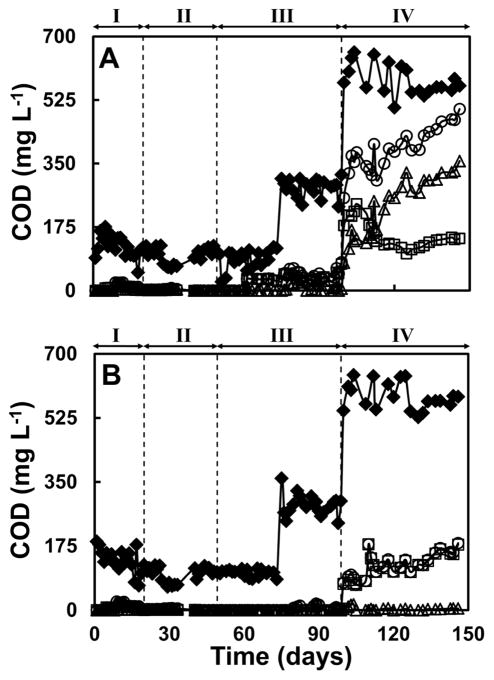
Figure 2.
Performance of the reactors in terms of the time course of the COD concentration in the influents and effluents of both reactors. Panel A, reactor lacking RF (R1). Panel B, reactor amended with RF (R2). Legends: (◆), total COD in the influent; (○), total COD in the effluent; (□), acetate-COD in the effluent; (Δ), ethanol-COD in the effluent. The vertical lines indicate the time when the concentrations of TeIV in the influents were increased.

