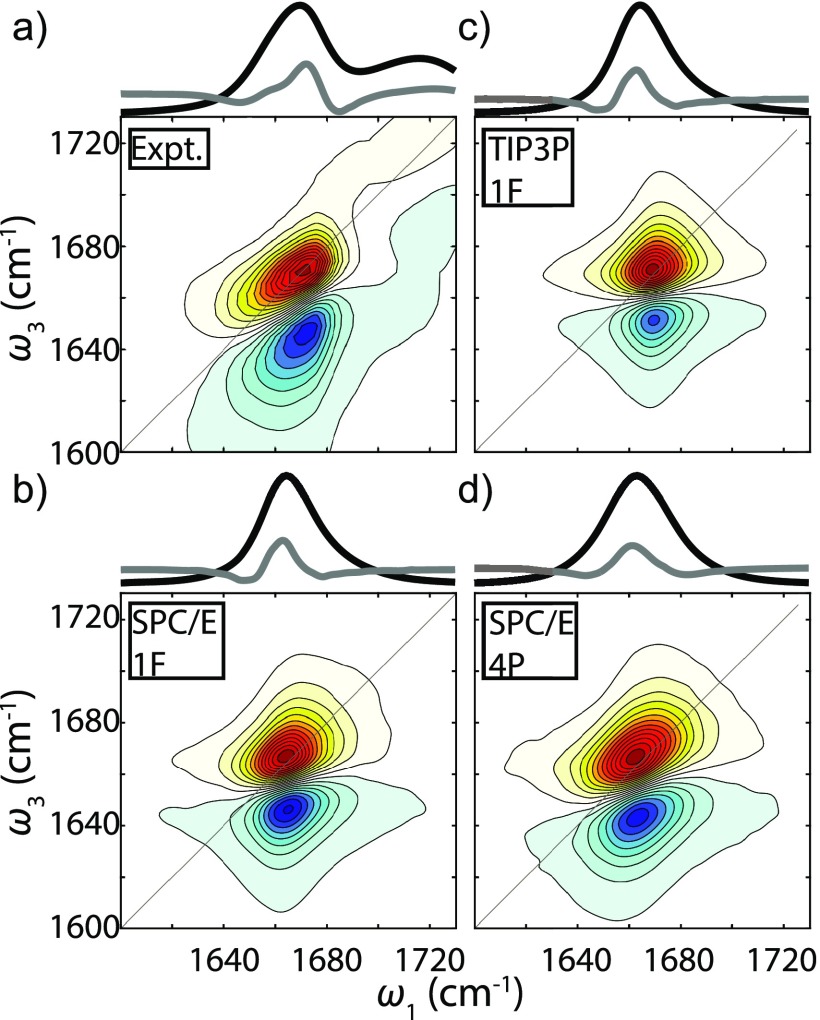
FIG. 1.
Amide I FTIR spectrum (black curve), second derivative of the FTIR spectrum (gray, scaled by −25), and ZZZZ polarized 2D IR spectrum of Ala–Ala. The waiting time of these 2D spectra is 0.15 ps. (a) Experimental spectrum. (b) Simulated spectrum from C36 SPC/E trajectory and the 1F map. (c) Simulated spectrum from C36 TIP3P trajectory and the 1F map. (d) Simulated spectrum from C36 SPC/E trajectory and the 4P map.

