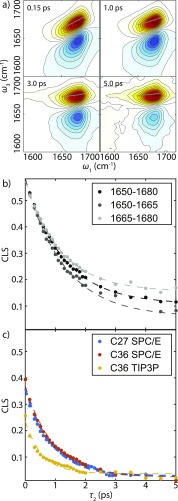
FIG. 2.
(a) Selected experimental waiting time series of magic angle 2D IR spectra from 0.15 ps to 5 ps. Center line derived from slices are shown in gray dots. [(b)–(c)] CLS decays for varying frequency ranges (dots) and the corresponding fit curves (dashed lines) from (b) the experiment, and (c) from the simulations using the 1F map.

