Figure 6.
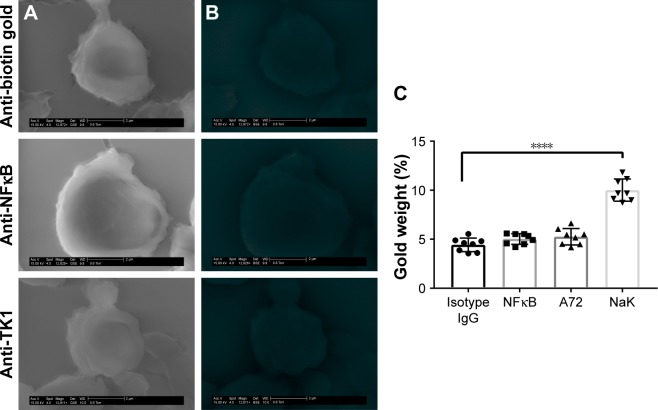
SEM of normal lymphocytes.
Notes: (A) Cells were stained with anti-biotin gold, anti-NFκB-biotin + anti-biotin gold, and anti-TK1 (A72)-biotin + anti-biotin gold visualized through a GSE detector. White spots represent gold bound to the membrane of the cells. (B) Images were filtered so the white spots (gold) could be represented in red for better visualization. No gold can be visualized in these samples. (C) EDAX quantification of gold weight percentages in normal lymphocytes stained with anti-biotin gold, anti-NFκB-biotin + anti-biotin gold, A72-biotin + anti-biotin gold, and a positive control Na+/K+ ATPase-biotin + anti-biotin gold. The amount of gold particles found on the surface of normal lymphocytes when stained with anti-TK1 A72 antibody is the same as the background indicating the absence of TK1 in these cells. ****P≤0.0001.
Abbreviations: EDAX, energy-dispersive analysis X-ray; GSE, gaseous secondary electron; SEM, scanning electron microscopy.

