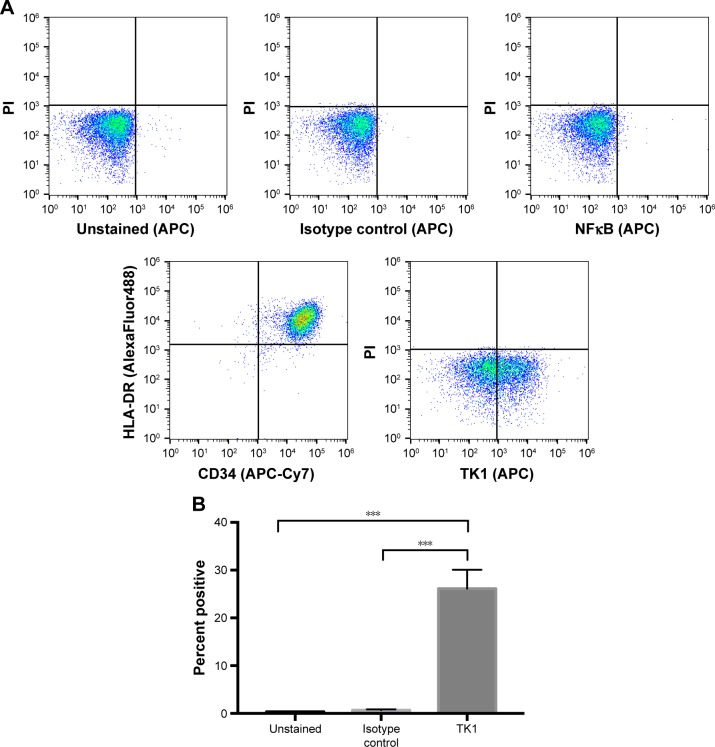
Figure 7.
Flow cytometry analysis of ALL clinical samples.
Notes: (A) Density plots of flow cytometry controls used in the analysis of ALL samples. Cells are CD45+ and HLA-DR+. Controls indicate an insignificant fluorescent shift in cells stained with isotype IgG control and anti-NFκB antibody. Cells appear to shift in fluorescence when bound to anti-TK1 antibody. (B) Quantification of cells shifting toward a greater fluorescence in ALL samples. ALL samples have a significant percentage of cells with a greater fluorescent shift compared to controls. ***P≤0.01.
Abbreviations: ALL, acute lymphoblastic leukemia; PI, propidium iodide.

