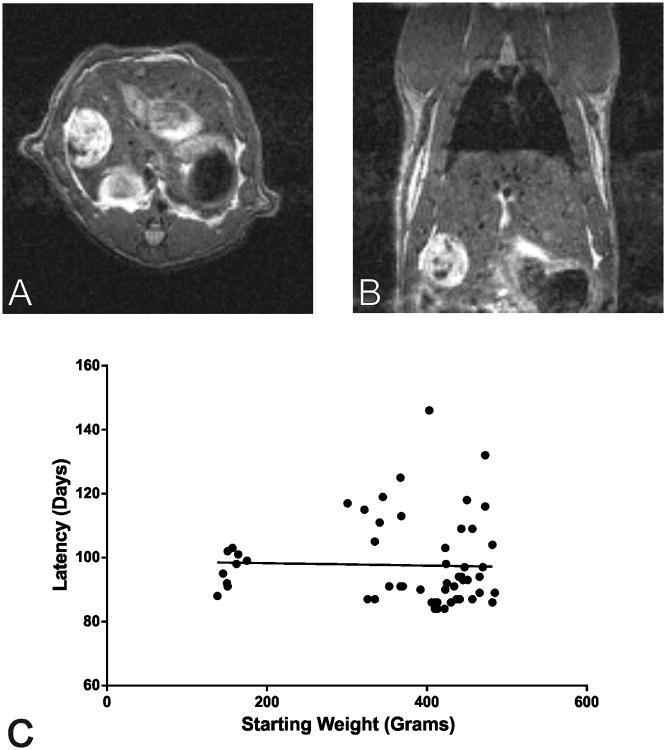
Figure 3.
Representative T2-weighted MR images for a rat showing a large tumor of HCC in the axial (Panel A) and coronal (Panel B) planes. Note that this tumor is the same one see in fluoroscopic images in Figure 5. Panel C shows a scatter plot of weight and tumor latency with overlaid line of best fit.

