Figure 4.
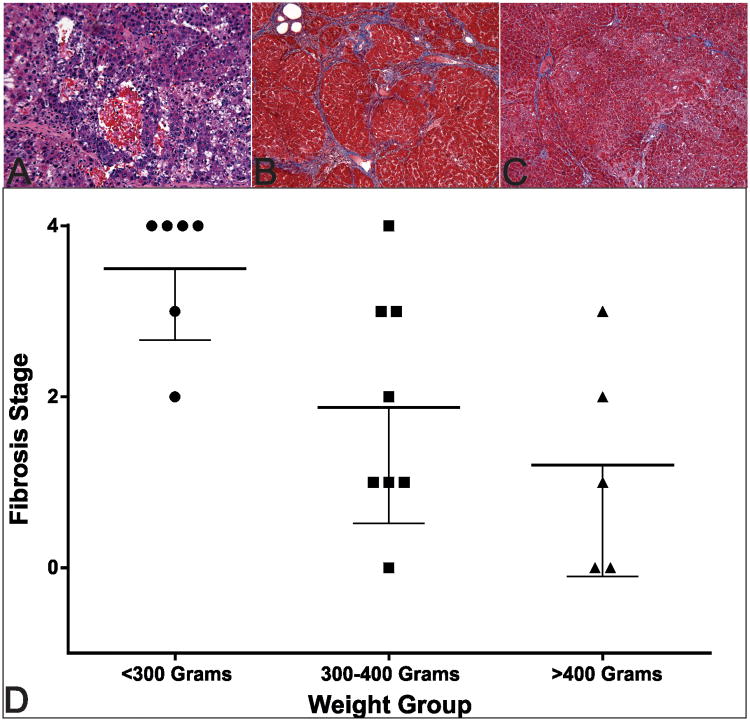
Representative staining of the histologic changes observed in this model. Panel A shows representative H&E staining of HCC in this rat model. Panel B demonstrates marked liver fibrosis (Stage 4) seen in a <300g rat. Panel C shows less severe fibrosis (Stage 1) in a >400g rat compared with the smaller rat in panel B. Panel D demonstrates group fibrosis stages with a trend toward increasing severity at lower weight and a significantly increased fibrosis in the <300g group. The bold line represents the mean and lower error bars indicate standard deviation.

