Fig. 2.
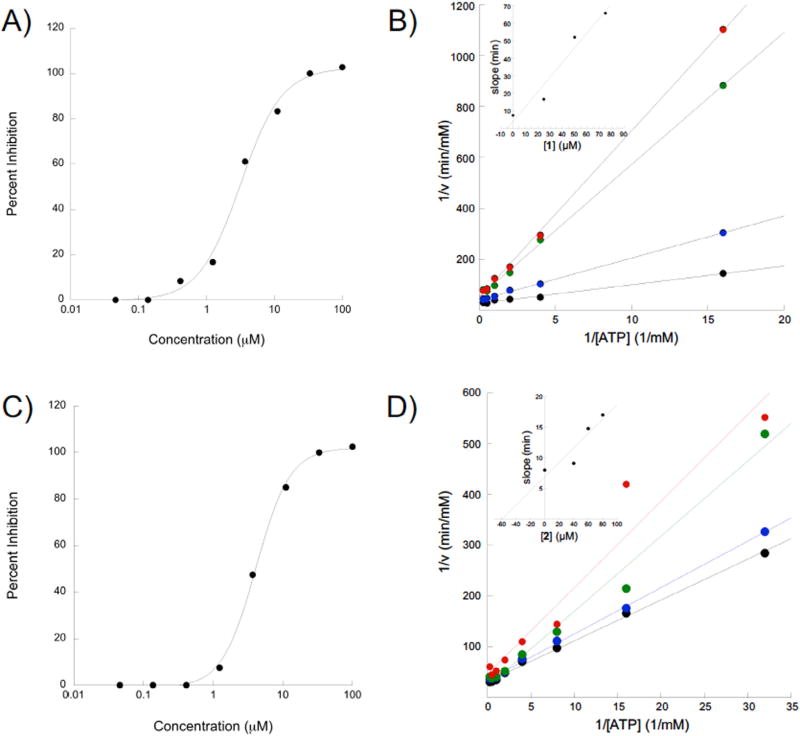
Compounds 1 and 2 inhibit eIF4A in an ATP competitive manner. A) Dose response of compound 1 and eIF4A. eIF4A ATPase activity was measured in the presence of serial dilutions of 1 and the percent inhibition was plotted as a function of [1] using a semi-log plot. B) Lineweaver-Burke analysis of 1 reveals a predominantly competitive mechanism. The inset shows a slope replot of the data as a function of inhibitor concentration. C) Dose-response for compound 2 conducted as for 1. D) Lineweaver-Burke analysis of compound 2 reveals a predominantly competitive mechanism of inhibition. The inset shows a slope replot of the data as a function of inhibitor concentration.

