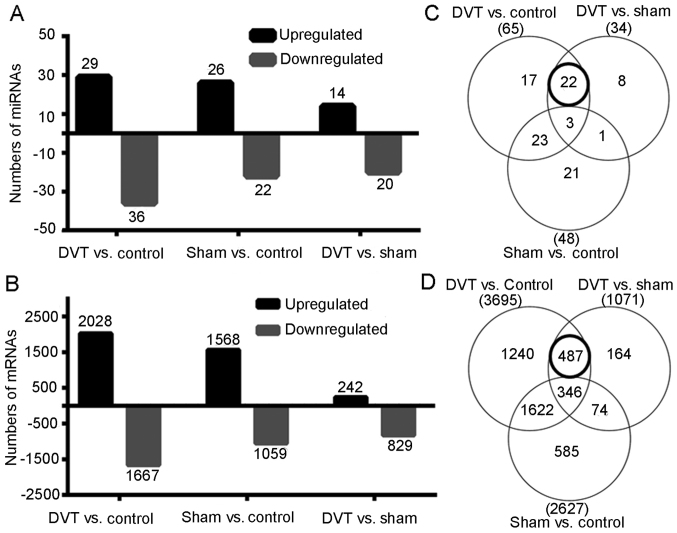
Figure 3.
Analysis of mRNA and miRNA expression in rat veins. Bar charts indicating the numbers of upregulated and downregulated (A) miRNAs and (B) mRNAs among the DVT, sham, and control groups. (C and D) Venn diagrams of the numbers of differentially expressed genes from comparisons of the DVT, sham, and control groups. mRNAs and miRNAs with 2-fold differences and statistical significance (P<0.05) were identified as differentially expressed mRNAs or miRNAs. The numbers in the overlapping areas (bold circles) represent differentially expressed miRNAs and mRNAs analyzed in the subsequent step. Differences were observed between the DVT group and the two other groups, but not between the control and sham groups. mRNA, messenger RNA; miRNA, microRNA.

