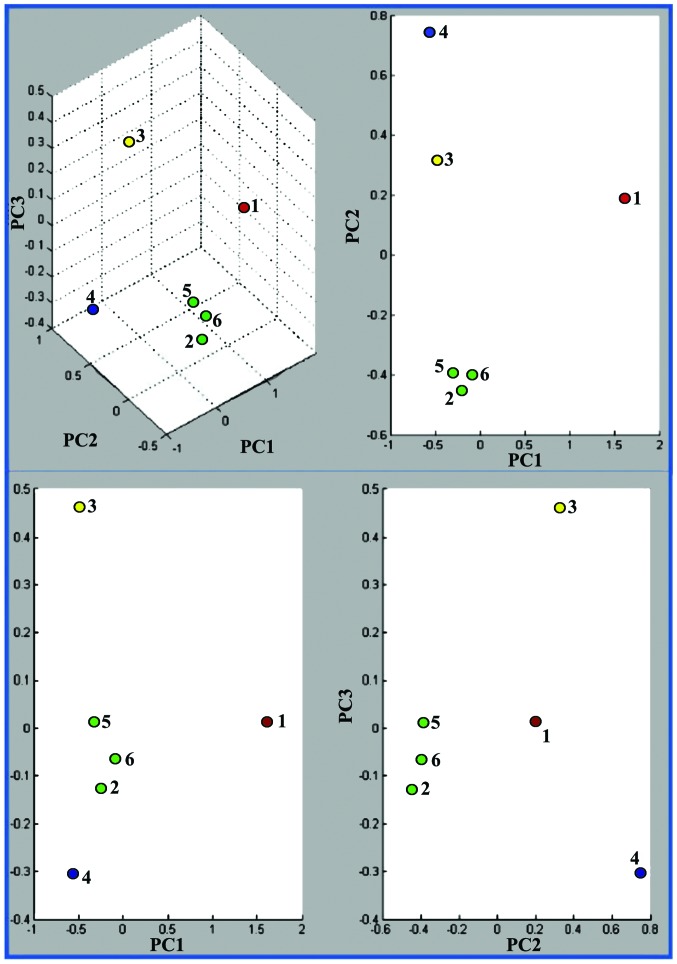
Figure 5.
PCA spectra clustering using 9,500–12,500 m/z interval. The top left score plot is a 3D plot of PC1 vs. PC2 vs. PC3 while on right is a 2D plots of PC1 vs. PC2, bottom left is PC1 vs. PC3 and bottom right PC2 vs. PC3. Each dot represents one spectra: 1, A375 (human melanoma); 2, HepG2 (human liver carcinoma); 3, B16-F0 (murine melanoma); 4, B164A5 (murine melanoma); 5, MCF7 (human breast carcinoma); and 6, MDA-MB-231 (human breast carcinoma). PCA, principle component analysis.

