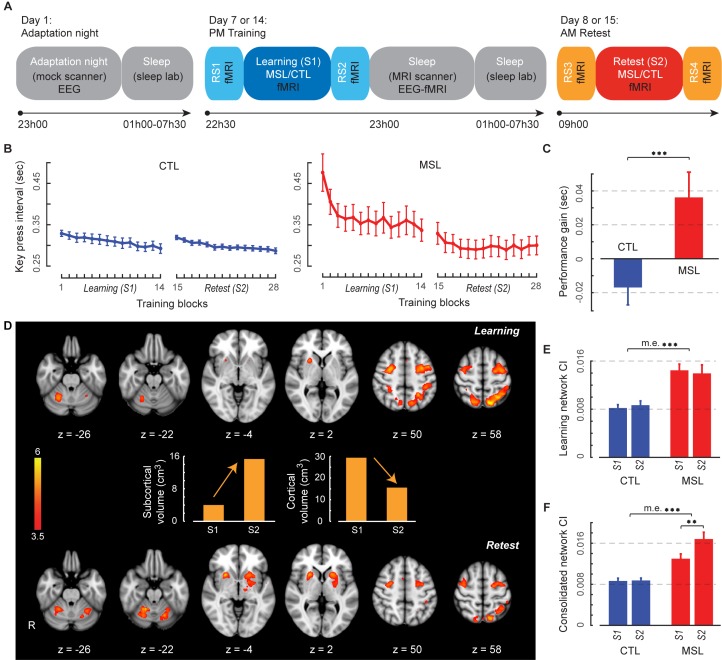
Figure 1. Experimental design, behavioral performance, and task activation maps.
(A) Experimental procedure. On Day 1, subjects first experienced a screening and adaptation night in the mock scanner, which mimicked conditions experienced in both experimental and control nights. Subjects returned and underwent fMRI scans (Day seven and Day 14) while training (S1) on either the motor skill learning (MSL) or motor control (CTL) task in a counterbalanced order, interleaved by resting-state conditions (RS1 and RS2). This was followed by simultaneous EEG-fMRI sleep recording for up to ~2.5 hr. Subjects were then allowed to sleep for the remainder of the night in the sleep lab. Finally, on the following morning subjects underwent retest fMRI sessions (S2) on the same take as the previous training session (Day eight and Day 15), interleaved by resting-state conditions (RS3 and RS4). Arrows shows the experiment’s timeline. (B) Performance speeds (i.e., inter-key interval) averaged across all subjects show that the learning curves differed between the MSL (red) and CTL (blue) conditions during the learning session (S1). (C) Only the MSL task was consolidated overnight, as indicated by performance gain averaged across subjects (asymptotic performance at the end of S1 compared to the beginning of S2). (D) Color-coded activation maps representing motor sequence-related areas during the learning (S1) and retest (S2) sessions (corrected for multiple comparisons using Gaussian random field theory, cluster level threshold ). Bar plots illustrate the volume of cortical and subcortical activation in each map. As expected, the connectivity index (CI) within the learning (E) and the consolidated (F) patterns was significantly higher in the MSL compared to the CTL condition. Error bars represent s.e.m.; ** and *** indicate and , respectively.
DOI: http://dx.doi.org/10.7554/eLife.24987.003


