. 2017 Sep 11;6:e24987. doi: 10.7554/eLife.24987

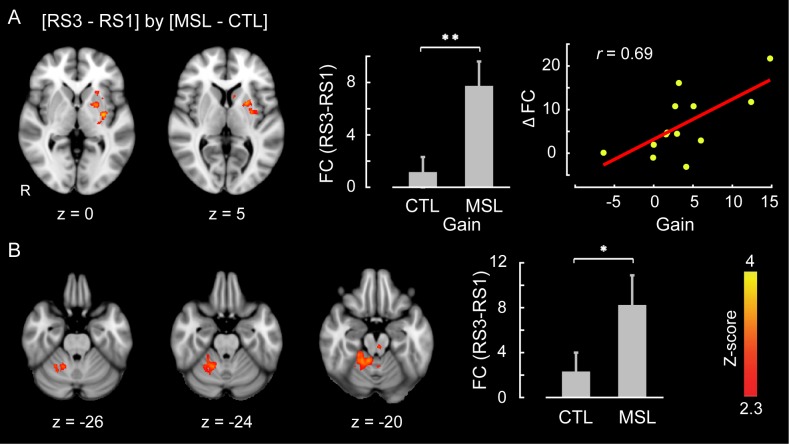
Figure 4. Neural correlates of motor sequence memory consolidation during post-sleep resting-state periods.

The ventrolateral putamen (A) and the cerebellar cortex (lobules V-VI) (B) functional connectivity within the consolidated pattern differed significantly between the MSL and CTL conditions during post-sleep resting-state periods (RS3) as compared to baseline (RS1). Bar plot illustrates the change in functional connectivity of putamen within the consolidated pattern between RS3 and RS1 scans averaged across subjects in each task condition. The scatter plot in (A) shows that only the putamen functional connectivity was significantly related to the extent of overnight behavioral gains in performance speed. The color-coded activations maps indicate Z-score values and are corrected for multiple comparisons using GRF, p<0.05. Error bars represent s.e.m.; * and ** indicate p<0.05 and p<0.01, respectively.

DOI: http://dx.doi.org/10.7554/eLife.24987.015

Figure 4.

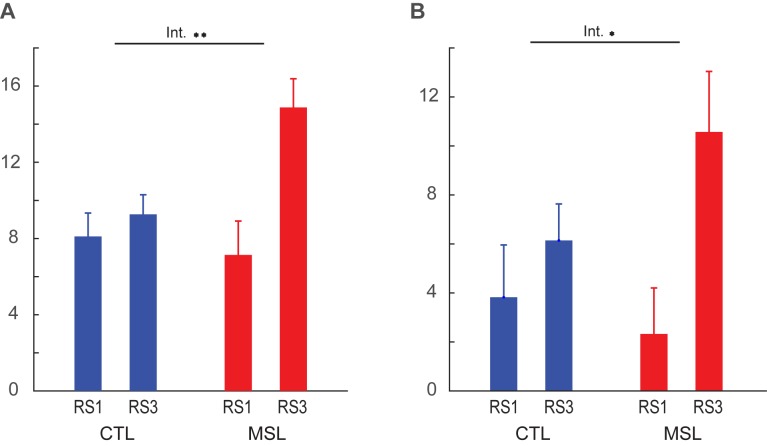
Figure 4—figure supplement 1. Functional connectivity within the consolidated pattern during post-sleep resting-state periods (RS3) and baseline (RS1) in each task.

Figure 4—figure supplement 1.

(A and B) illustrate, respectively, the average functional connectivity values of the putamen and cerebellum clusters (see Figure 4) within the consolidated pattern during RS3 and RS1 scans in each task condition. Error bars represent s.e.m.; * indicates significant (p<0.05) interaction between task and resting-state condition.
Figure 4—figure supplement 2. Neural correlates of motor sequence learning during resting-state periods immediately following training.

Figure 4—figure supplement 2.

The posterior parietal lobule functional connectivity within the learning pattern significantly differed between the MSL and CTL tasks during the resting-state condition immediately following training (RS2) as compared to baseline (RS1). Bar plot illustrates the change in functional connectivity of this area within the learning pattern between RS2 and RS1 scans averaged across all subjects in each task condition. The color-coded activation map indicates Z-score values and is corrected for multiple comparisons using GRF, p<0.05. Error bars represent s.e.m.
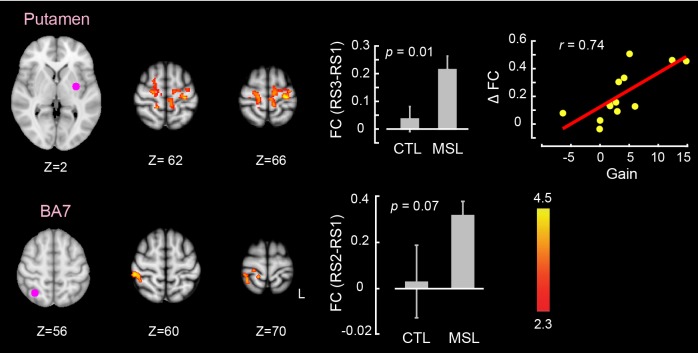
Figure 4—figure supplement 3. Changes in brain functional connectivity related to motor sequence learning during the post-sleep (top row) and the pre-sleep (bottom row) resting-state conditions.

Figure 4—figure supplement 3.

An ROI located in the let putamen showed a significant change in functional connectivity between tasks during the post-sleep resting state condition (RS3) as compared to the baseline (RS1); significant interaction (RS3RS1)×(MSLCTL), top row. In contrast, an ROI located in the right posterior parietal cortex (brodmann area, BA7) showed a significant change in functional connectivity between tasks during the pre-sleep resting state condition immediately following learning (RS2) as compared to the baseline (RS1); significant interaction (RS2RS1)×(MSLCTL), bottom row. As shown in the scatter plot, only changes in functional connectivity in the post-sleep condition were correlated with the amount of offline gains in performance speed. All maps are corrected for multiple comparisons using GRF, p<0.05. Display conventions are as in Figure 3—figure supplement 1.