. 2017 Sep 11;6:e24987. doi: 10.7554/eLife.24987

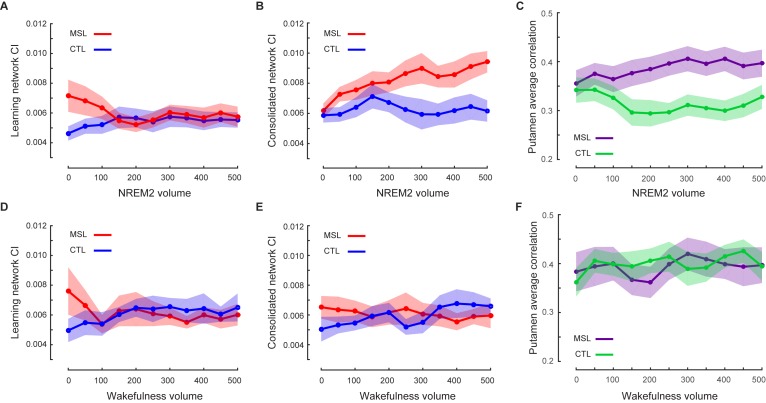
Figure 5. Temporal dynamics of memory trace during NREM stage two sleep.

(A, B) illustrate the time course of CI change within the learning and the consolidated patterns during NREM stage two sleep, respectively. The consolidated pattern’s CI gradually increased during NREM sleep only in the MSL condition (red curve), while the learning pattern’s CI decreased. CI did not differ significantly over the course of NREM stage two sleep in the CTL night (blue curves). Furthermore, CI within the learning (D) and consolidated (E) patterns did not change significantly over the course of intermittent awakenings distributed throughout the sleep session in the CTL (blue curves) or MSL (red curves) night. (C), (F) illustrate the time course of ventrolateral putamen functional connectivity within the consolidated pattern during NREM stage two sleep and intermittent bouts of awakenings, respectively. Likewise, the putamen functional connectivity with the rest of structures in the consolidated pattern gradually increased only during NREM sleep in the MSL condition. Each data point is calculated using 100 fMRI volumes. Shaded area represents s.e.m.

DOI: http://dx.doi.org/10.7554/eLife.24987.019

Figure 5—source data 1. Average duration and number of epochs used in the temporal dynamics analysis (Figure 5).
Table reports the average epoch duration and the number of epochs which were used in data analysis during the sleep scanning session in the MSL or CTL condition nights. Mean and SEM duration values are reported in minutes. p values are calculated based on paired t-statistics, and Wilcoxon signed rank test for the average duration and the number of epochs, respectively.
DOI: 10.7554/eLife.24987.020

Figure 5.

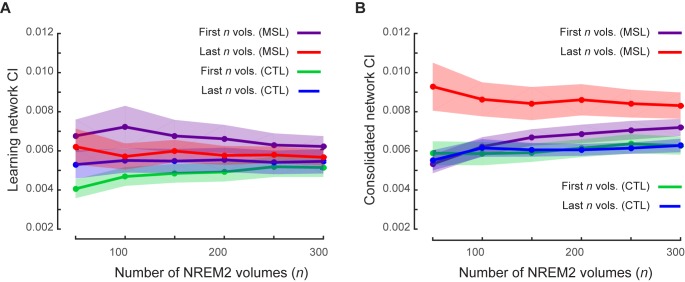
Figure 5—figure supplement 1. Robustness of temporal dynamics analysis with respect to the window size.

Figure 5—figure supplement 1.

(A, B) illustrate the CI values, averaged over subjects, within the learning and the consolidated patterns respectively during non-REM stage two sleep (including on average 600 volumes) using different window sizes ranging from n = 50 to 300 volumes. Each curve is calculated using different time windows comprising either the first n fMRI volumes (purple, green) or the last n fMRI volumes (red, blue) in the MSL (purple, red) or the CTL (green, blue) condition. Shaded area represents s.e.m.