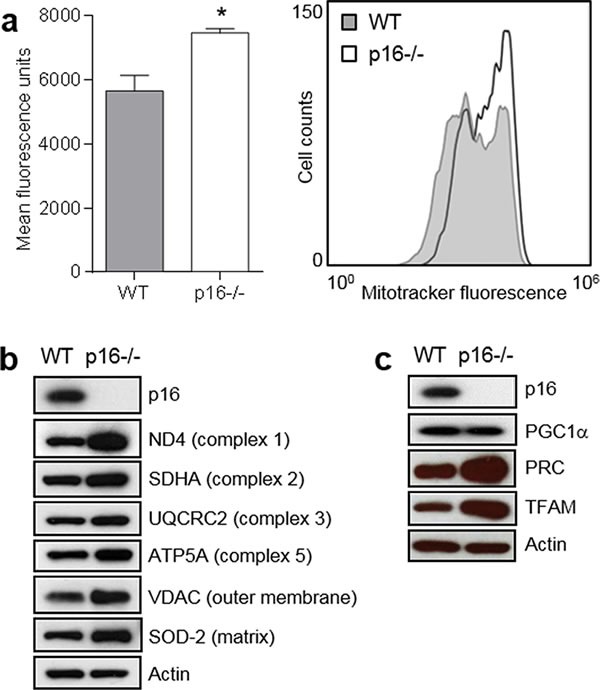
Figure 1. p16-deficient cells display increased mitochondrial mass and biogenesis.

a. Mitochondrial mass. Left, wild-type (WT) and p16−/− primary fibroblasts were stained with MitoTracker-Green, and analyzed by flow cytometry. Error bars indicate SEM from triplicate determinations, *P = 0.02. Right, representative histogram. b. Western blotting for mitochondrial structural proteins in WT and p16−/− fibroblasts, with Actin as a loading control. c. Western blotting for proteins in WT and p16−/− fibroblasts that regulate mitochondrial biogenesis, with Actin as a loading control.
