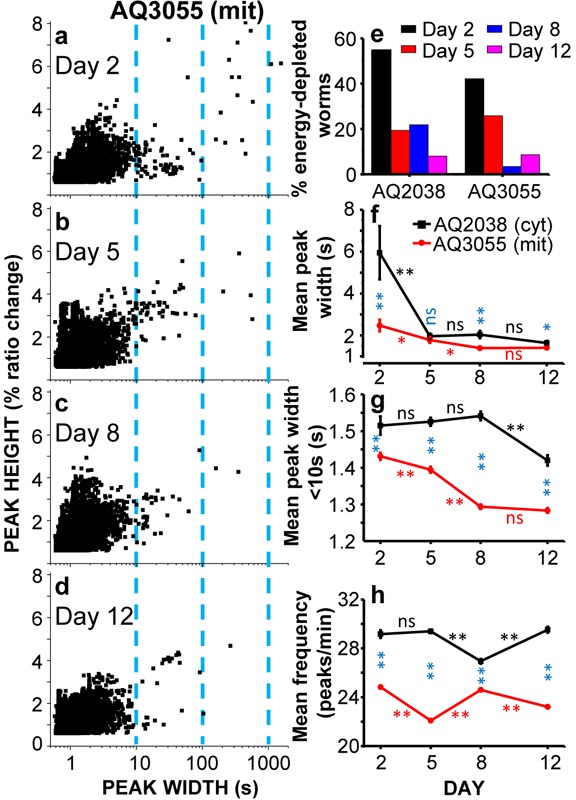
Figure 3. Comparative analysis of [Ca2+]C and [Ca2+]M dynamics in AQ2038 (N2 worms expressing the cytosolic [Ca2+] sensor) or AQ3055 (N2 worms expressing the mitochondrial Ca2+ sensor) worms of 2, 5, 8 and 12 days old, at 2.5Hz image resolution.

Panels a-d show plots of peak height against peak width for all the [Ca2+]M peaks analyzed in AQ3055 worms of 2 (panel a., 8414 peaks from 38 worms studied), 5 (panel b., 9365 peaks from 29 worms studied), 8 (panel c., 10802 peaks from 29 worms studied) and 12 (panel d., 11232 peaks from 35 worms studied) days old. Panel e. shows the percentage of worms considered as energy-depleted because the [Ca2+]c or [Ca2+]M record shows or ends in prolonged “square wave” [Ca2+] peaks. Panels f.-h. show the variation with worm age of the main parameters analyzed in the Ca2+ imaging experiments performed in AQ2038 and AQ3055 worms: mean peak width (panel f), mean peak width considering only peaks with width < 10s (panel g) and mean peak frequency (panel h). Significance was obtained by the ANOVA test (*, p < 0,05; **, p < 0,001; ns, not significant) comparing: i) the [Ca2+]C and [Ca2+]M data of the same day (blue symbols), ii) the [Ca2+]C data of every two consecutive days (black symbols) and iii) the [Ca2+]M data of every two consecutive days (red symbols).
