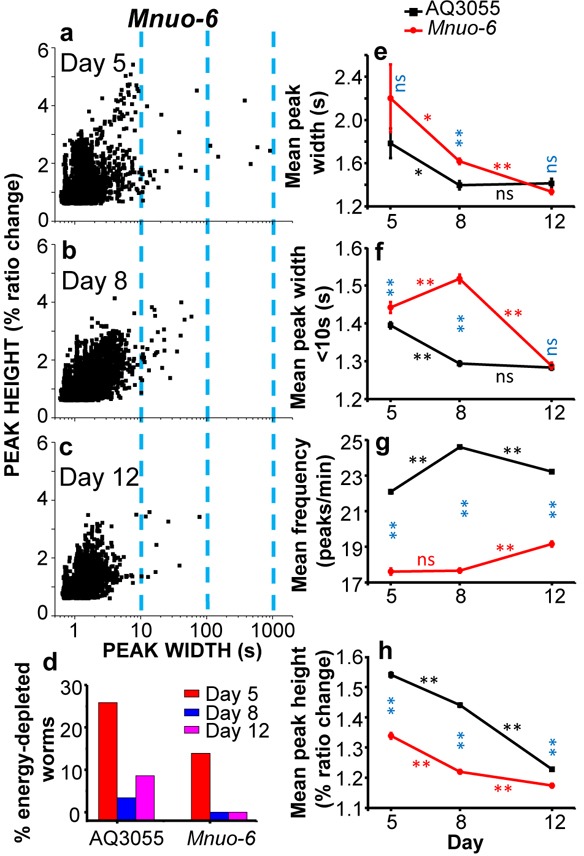
Figure 5. Comparative analysis of [Ca2+]M dynamics in AQ3055 or Mnuo-6 worms of 5, 8 and 12 days old.

Panels a.-c. show plots of peak height against peak width for all the [Ca2+]M peaks analyzed in Mnuo-6 worms of 5 (panel a, 4016 peaks from 36 worms studied), 8 (panel b, 5512 peaks from 28 worms studied) and 12 (panel d, 4430 peaks from 23 worms studied) days old. Panel d. shows the percentage of worms considered as energy-depleted in each case. The other panels e.-h. compare the evolution with age of the main parameters analyzed in both types of worms, AQ3055 and Mnuo-6: mean peak width (panel e), mean peak width considering only peaks with width < 10s (panel f), mean peak frequency (panel g) and mean peak height (panel h). Significance was obtained by the ANOVA test (*, p < 0,05; **, p < 0,001; ns, not significant) comparing: i) the control and mutant nuo-6 [Ca2+]M data of the same day (blue symbols), ii) the control [Ca2+]M data of every two consecutive days (black symbols) and iii) the mutant nuo-6 [Ca2+]M data of every two consecutive days (red symbols).
