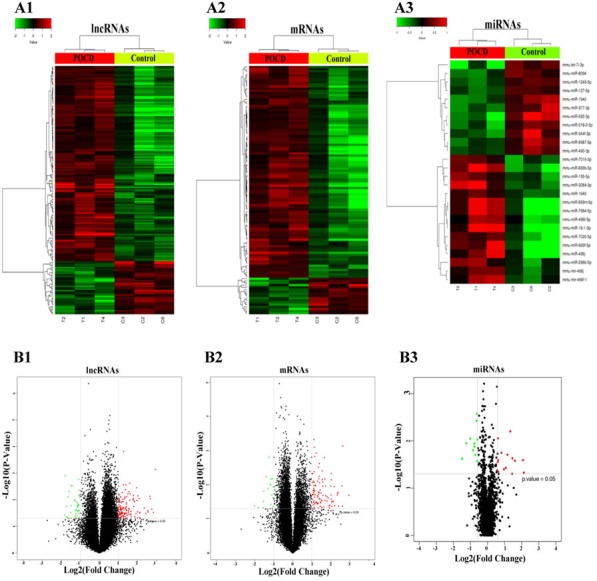
Figure 2. Heatmap and volcano plots showing lncRNA, mRNA, and miRNA levels.

Screening criteria were: FC > 2.0 and P ≤ 0.05 for lncRNAs A1. and mRNAs A2., and FC > 1.5 and P ≤ 0.05 for miRNAs A3. Expression values are depicted in line with the color scale; intensity increases from green to red. Each column represents one sample, and each row indicates a transcript. Volcano plots reflecting number, significance, and reliability of differentially expressed lncRNAs B1., mRNAs B2., and miRNAs B3. The abscissa is log2 (FC value) and the ordinate is -log10 (P-value). Red dots are upregulated genes, green dots are downregulated genes, and black dots are genes that were the same between the two groups.
