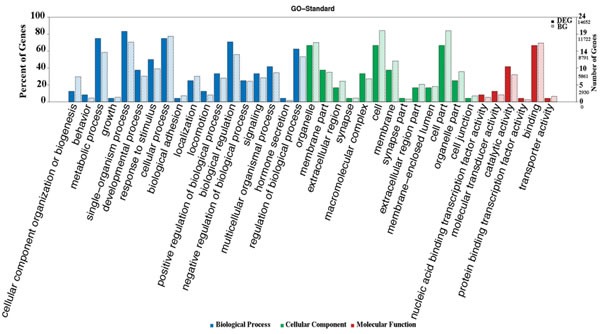
Figure 3. GO secondary ID frequency analysis.

The abscissa of the chart is the classification of the GO database. The left ordinate is the percent of genes. Solid bars: ratio of the number of differentially expressed genes enriched to a secondary function of the GO database to all differentially expressed genes; grid bars: ratio of the number of background genes enriched to a secondary function of the GO database to all genes. The percentage of differentially expressed genes enriched to a secondary function of the GO database may be higher or lower than the percentage of the background genes. The right ordinate is the number of genes. Each node on the right ordinate includes two numbers; the smaller is the number of differentially expressed genes and the larger is the number of background genes. Blue bars are biological processes, green are cellular components, and red are molecular functions.
