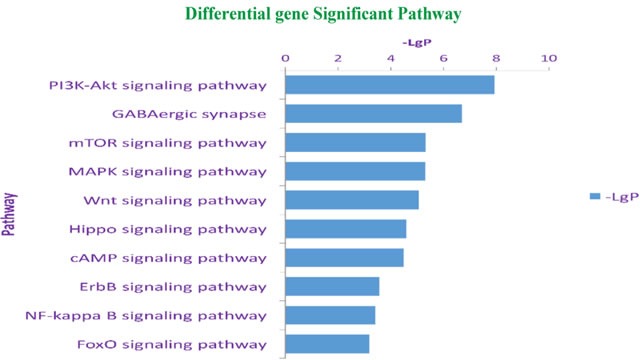
Figure 4. KEGG pathway enrichment analysis for mRNAs with the ten highest enrichment scores.

Pathway enrichment analysis includes two steps: (1) map input gene sets into the database, and then annotate the pathways involved in these gene sets; (2) compare the results obtained in the previous step with the background genes, and identify significant enrichment pathways. Statistical testing was performed using Hypergeometric Distribution. The abscissa is -Log P-value (-LgP). The bigger the -LgP, the smaller the P-value, indicating that enrichment of differentially expressed genes in a given pathway was significant.
