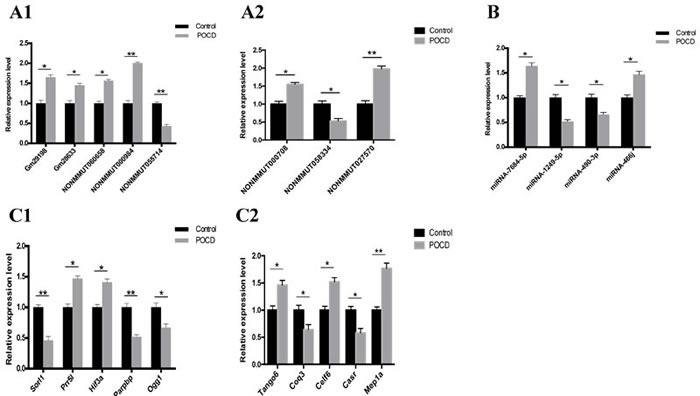
Figure 7. Transcript validation via quantitative RT-PCR.

Relative expression of eight lncRNAs A., four miRNAs B., and ten mRNAs C. between the POCD and control groups are shown. *P < 0.05, **P < 0.01.

Relative expression of eight lncRNAs A., four miRNAs B., and ten mRNAs C. between the POCD and control groups are shown. *P < 0.05, **P < 0.01.