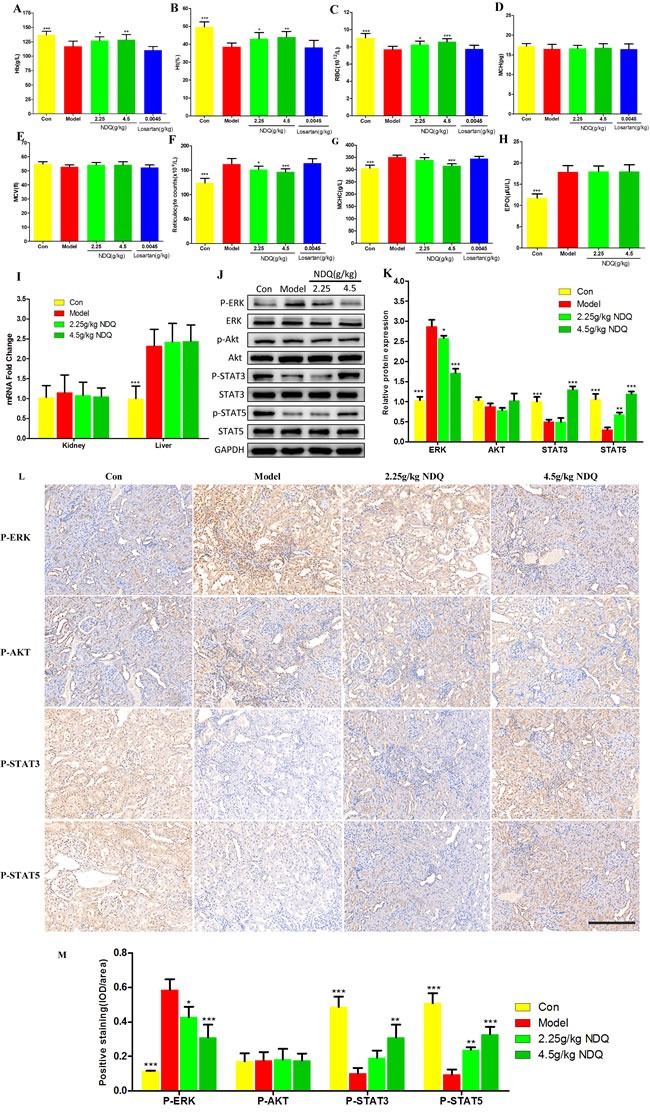
Figure 8. Effect of NDQ on renal anemia and activation of downstream mediators of the EPO receptor.

A.-G. Hematological data throughout the study. Hb: hemoglobin; Ht: hematocrit; RBC: red blood cells; MCH: mean cell hemoglobin; MCV: mean cell volume; Rtc: reticulocyte count; MCHC: mean cell hemoglobin concentration. H. Serum EPO level was measured by ELISA at the end of the experiment. I. EPO mRNA expression in kidney and liver was determined by real-time PCR and normalized to the expression of GAPDH. J. Rat kidneys were harvested at the end of the experiment, and tested to determine the expression of p-ERK, ERK, p-AKT, AKT, p-STAT3, STAT3, p-STAT5, and STAT5 by western blotting. GAPDH was used as the loading control. K. Densitometric analysis for ERK, AKT, STAT3 and STAT5 expression. L. ERK, AKT, STST3 and STAT5 expression in the remnant kidney of CKD rats were analyzed by immunohistochemistry (200×, scale bar represents 500 μm). M. Expression of ERK, AKT, STST3 and STAT5 was analyzed quantitatively. Data are presented as means ± SD. *p < 0.05, **p < 0.01, ***p < 0.001 (versus untreated model group).
