
Figure 1. SAHA suppresses HIF-1α and HIF-2α induction in response to hypoxia.
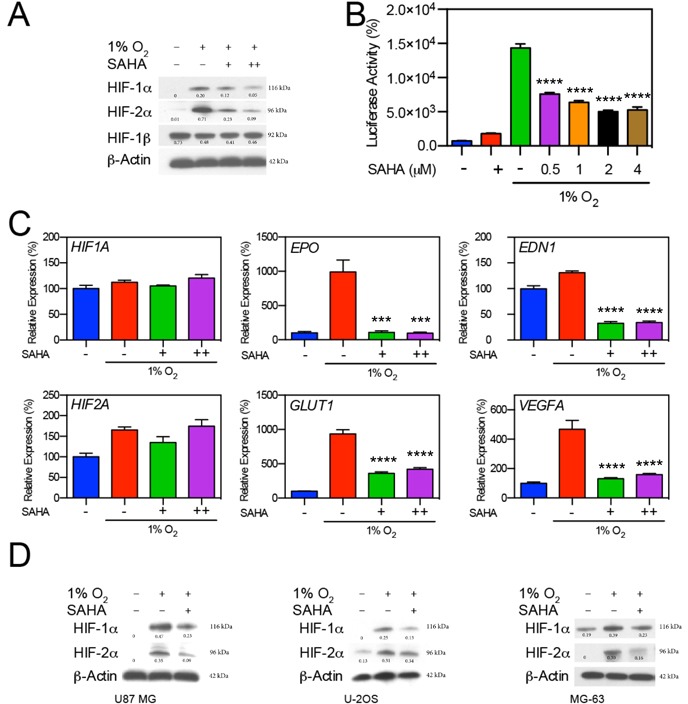
A. Hep3B cells were exposed to hypoxic conditions (1% O2) for 16 hr in the presence of 0.5 or 1 μM of SAHA (+, and ++, respectively). Representative western blot with normalized densitometric values (protein/actin loading control) show decreases in HIF-1α and HIF-2α expression upon exposure to SAHA. B. Luciferase reporter assay demonstrates significant decreases (p < 0.0001) in HRE-associated luciferase activity in response to SAHA under hypoxic conditions. C. Effects of SAHA on hypoxia related gene expression in Hep3B cells exposed to SAHA for 16 hr under conditions of 21% or 1% O2 analyzed by qRT-PCR, showing significant suppression of EDN1, EPO, GLUT1, and VEGFA in response to both 0.5 and 1 μM SAHA with no significant change in HIF1A or HIF2A expression. D. Tumor cell lines U87 MG, U2OS, and MG63 were exposed to 0.5 μM SAHA for 16 hr under 21% or 1% O2, with resulting HIF-1α and HIF-2α suppression similar to that observed in Hep3B cells. Representative western blot with normalized densitometric values (protein/actin loading control) are shown. *p < 0.05, **p < 0.01, ***p < 0.001, ****p < 0.0001.