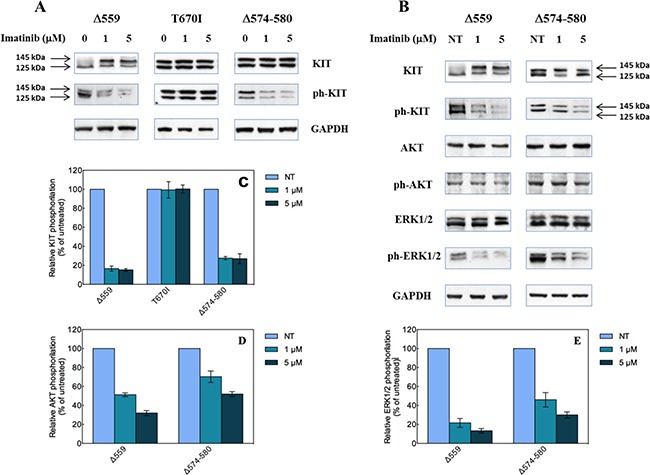
Figure 5. Biological effects of the Δ574–580 mutation on KIT receptor activity.

(A) Western blot analysis of HEK293 cells transfected with the indicated KIT mutant constructs, untreated (0 μM) or treated with 1 or 5 μM Imatinib. (B) Quantitative analysis of relative KIT phosphorylation (bottom) expressed as % ratio between phosphorylated and total KIT levels and referred to untreated cells. Data represent the average of three independent experiments ± the standard deviation. (C) Effect of Imatinib on AKT and ERK1/2 phosphorylation induced by expression of Δ559 and Δ574–580 KIT deleted mutants in transiently transfected HEK293 cells. Arrows indicate the 145 and 125 kDa KIT receptor forms. (D and E) Quantitative analysis of relative AKT (D) and ERK1/2 phosphorylation (E) expressed as % ratio between phosphorylated and total protein levels and referred to untreated cells. Data represent the average of three independent experiments ± the standard deviation.
