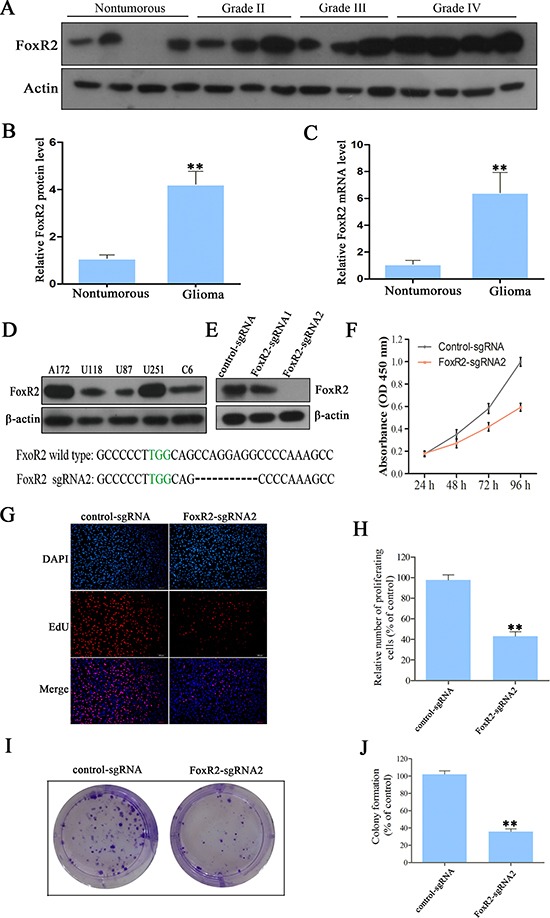
Figure 1. The effects of FoxR2 knockout on cell proliferation of glioma.

(A) Representative protein level of FoxR2 in nontumorous brain tissues and glioma tissues. (B) Statistical analysis of the relative protein level of FoxR2 in nontumorous brain tissues (n = 9) and glioma tissues (n = 33), **P < 0.01. (C) The relative FoxR2 mRNA expression in nontumorous brain tissues and glioma tissues as measured by real time RT-PCR. For each sample, the relative FoxR2 mRNA level was normalized to that of GAPDH, **P < 0.01. (D) The expression analysis of FoxR2 in five glioma cell lines by western blot analysis. (E) Knockout efficiency of FoxR2 was examined by western blot analysis in FoxR2-sgRNA1, FoxR2-sgRNA2 and corresponding control cells. (F) CCK8 assay was used to detect the cell viability in control-sgRNA and FoxR2-sgRNA1 U251 cells. (G) The proliferative abilities of FoxR2 knockout cells were assessed by the EdU incorporation assay. Representative images of EdU (red) and DAPI (blue) are showed, scale bar: 200 μm. (H) Quantification of the percentage of EdU-positive cells. (I) Cell proliferation ability after FoxR2 knockout was examined by colony formation assay. (J) Quantitative results of colony formation assay. The percentage of proliferative cells and the amount of colony formation were normalized to the corresponding values of the control-sgRNA group. All the results were presented as the mean ± SEM from 3 independent experiments, *P < 0.05, **P < 0.01.
