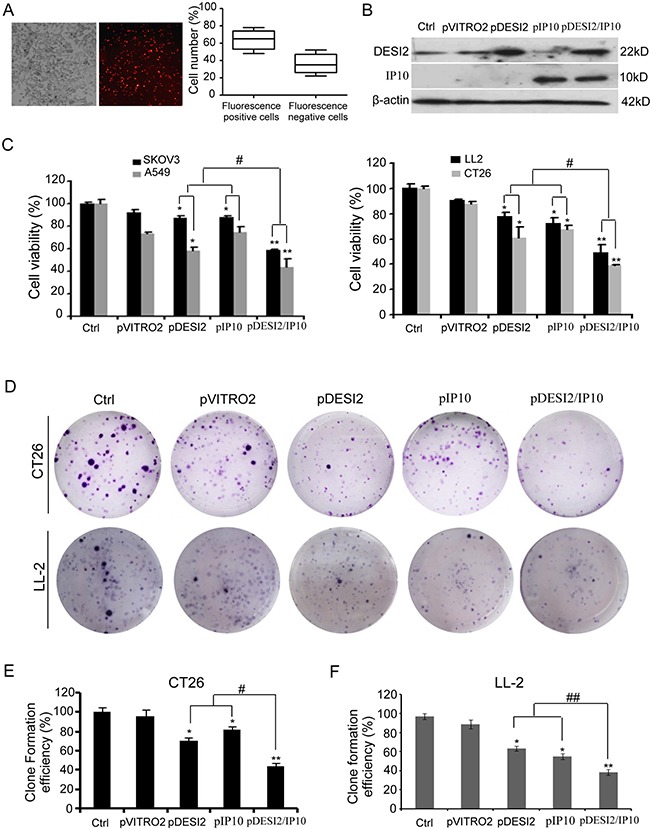
Figure 1. Reduced viability of cancer cells in vitro by co-expression of DESI2 and IP10.

(A) CT26 cells were transfected with pVITRO2-RFP plasmid for 36h, and then the transfection efficiency was estimated by a fluorescence microscope. The representative picture of red fluorescence positive cells was shown (left panel). Transfection efficiency was further quantified as the percentage of fluorescence positive cells to total cells. Bars, SD; columns, mean (n = 5) (left panel). (B) Western blotting analysis of DESI2 and/or IP10 expression in vitro after transfection of CT26 cells. β-actin was used as a loading control. (C) Treatment of SKOV3, A549, LL2 and CT26 cells with DESI2 plus IP10 for 48 h reduced their viabilities more significantly than that of DESI2 alone or IP10 alone did. The MTT assay was carried out as described in Materials and Methods. Statistically significant differences compared with the two control groups (*P < 0.05; **P <0.01) and the two single-treatment groups (#P < 0.05). Percentage of survival was calculated. Bars, SD; columns, mean (n = 3). In each experiment, the medium-only treatment (untreated) indicates 100% cell viability. (D) Colony-formation assays were further used to evaluate the viability of CT26 and LL2 cells. Co-expression of DESI2 and IP10 resulted in significant inhibition of clone formation compared with the DESI2 and IP10 groups. (E) Clone formation efficiency of CT26 cells was quantified as the percentage of different group clones to control clone numbers. Statistically significant differences compared with the two control groups (*P < 0.05; **P <0.01) and the two single-treatment groups (#P < 0.05). Bars, SD; columns, mean (n = 3). (F) Clone formation efficiency of LL2 cells was quantified as the percentage of different group clones to control clone numbers. Statistically significant differences compared with the two control groups (*P < 0.05; **P <0.01) and the two single-treatment groups (##P < 0.01). Bars, SD; columns, mean (n = 3).
