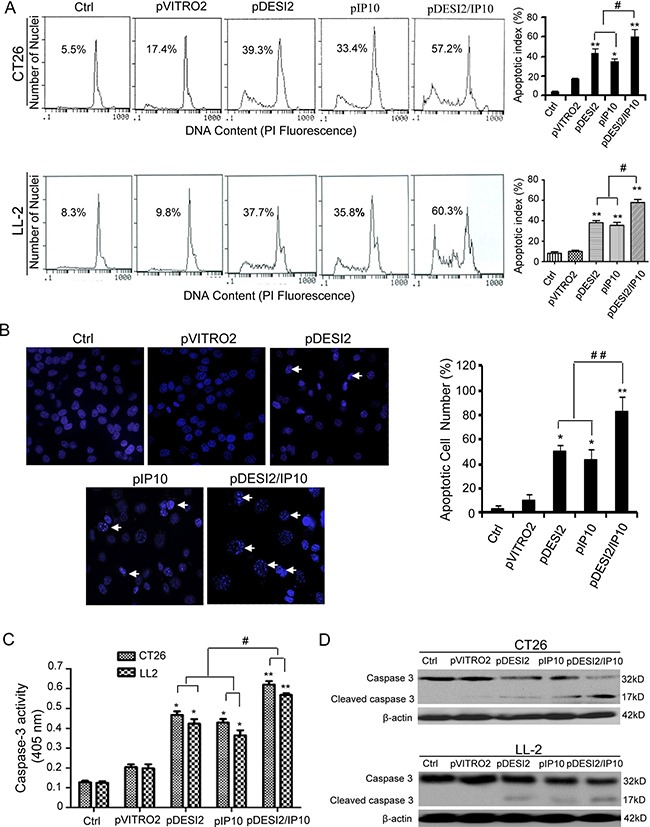
Figure 2. Induction of apoptosis of CT26 tumor cells in vitro by DESI2 and/or IP10.

(A) Representative DNA fluorescence histograms of propidium iodide-stained cells. CT26 and LL-2 cells were transfected with DESI2 and/or IP10 for 48 h. CT26 and LL-2 cells were untreated or transfected with pVITRO2 empty vector , pDESI2, pIP10 or pDESI2/IP10, with (1) 5.5 % and 8.3 %, (2) 17.4 % and 9.8 %, (3) 39.3% and 37.7%, (4) 33.4% and 35.8, and (5) 57.2% and 60.3% sub-G1 cells (apoptotic cells), respectively, as assessed by flow cytometry (left). Co-expression of DESI2 and IP10 induced more significant apoptosis of CT26 and LL2 cells than the DESI2 and IP10 groups did (right). Statistically significant differences compared with the two control groups (*P < 0.05; **P < 0.01) and the two single-treatment groups (#P < 0.05). Bars, SD; columns, mean (n = 3). (B) Normal and apoptotic nuclear morphologies of CT26 cells were shown (left). CT26 cells were treated with the same conditions as described above and used to analyze the nuclear morphology by Hoechst 33258 staining. Arrows represented some typically apoptotic nuclear morphology. Co-expression of DESI2 and IP10 resulted in significant increase of the number of the apoptotic nuclei compared with the DESI2 and IP10 groups (right). Bars, SD; columns, mean (n = 3, *p < 0.05; **p < 0.01; ##P < 0.01). (C) Co-expression of DESI2 and IP10 activated caspase-3 both in CT26 and LL2 cells. CT26 and LL2 cells were treated as described in A. The treated cells were then lysed and caspase 3 activity was measured using an assay kit (n = 3; *p < 0.05; **p < 0.01; #p < 0.01). (D) Co-expression of DESI2 and IP10 resulted in cleavage of caspase-3. CT26 and LL2 cells were subjected to the indicated treatments as described above. Caspase activation was analyzed by western blotting. β-actin was used as a loading control.
