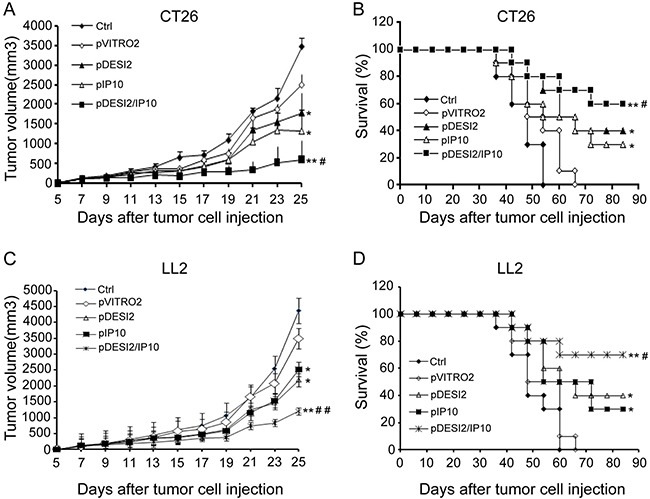
Figure 3. Improved therapeutic effect of co-expression of DESI2 and IP10 on two murine tumor models.

Female mice at 6–8 weeks of age were transplanted subcutaneously with 5 × 10⁵ CT26 or 5 × 10⁵ LL2 cells. 5 days after tumor cells were transplanted, the mice were assigned randomly to five groups and treated with 5% GS, pVITRO2, pDESI2, pIP10, pDESI2/IP10. (A) Suppression of tumor growth in CT26-bearing mice. The sizes (mm3) of tumors were monitored and recorded. pDESI2/IP10 treatment resulted in significant tumor growth inhibition. Significant differences for tumors treated with DESI2 or IP10 versus 5% GS and pVITRO2 controls (*P < 0.05; **P < 0.01); and significant difference for DESI2 plus IP10 therapy versus DESI2 or IP10 monotherapy (#P < 0.05). Bars, SD; Points, mean. (B) Survival curve of CT26-bearing mice per treatment group. Statistically significant differences compared with 5% GS and pVITRO2 controls (*P < 0.05; **P < 0.01). Significant differences compared with the two single-treatment groups (#P < 0.05). (C) Suppression of tumor growth in LL2-bearing mice. The sizes (mm3) of tumors were monitored and recorded. pDESI2/IP10 treatment resulted in significant tumor growth inhibition. Significant differences for tumors treated with DESI2 or IP10 versus 5% GS and pVITRO2 controls (*P < 0.05; **P < 0.01); and significant difference for DESI2 plus IP10 therapy versus DESI2 or IP10 monotherapy (##P < 0.01). Bars, SD; Points, mean. (D) Survival curve of LL2-bearing mice per treatment group. Statistically significant differences compared with 5% GS and pVITRO2 controls (*P < 0.05; **P < 0.01). Significant differences compared with the two single-treatment groups (#P < 0.05).
