
Figure 5. Antiangiogenesis by alginate bead assay in vivo.
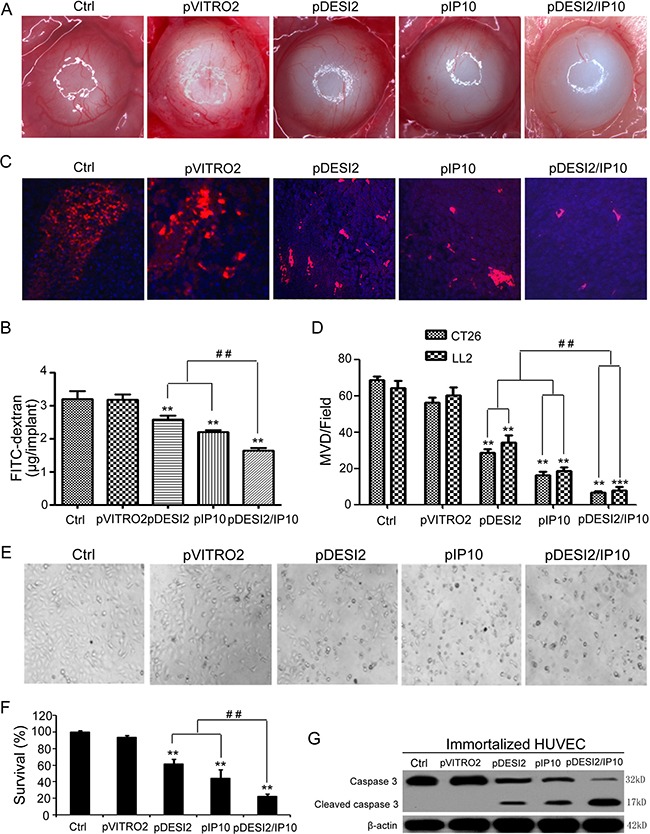
(A) Antiangiogenesis assay by alginate bead in vivo. Alginate beads containing 1 × 10⁵ CT26 tumor cells were subcutaneously implanted into the backs of BALB/c mice (four beads per mouse). The treatments of mice (five mice/group) and the quantification of FITC-dextran uptake were described in Materials and Methods. Representative images of alginate beads after treatment with 5% GS, pVITRO2, pDESI2, pIP10, and pDESI2/IP10 were shown under a dissecting microscope (×10). (B) FITC-dextran of alginate beads was quantified. Statistically significant difference in the FITC-dextran uptake from the mice treated with IP10 or DESI2 versus 5% GS and pVITRO2 controls (**P < 0.01); significant difference in the FITC-dextran uptake from the mice treated with pDESI2/IP10 versus the two controls (**P < 0.01); and significant difference for the combination therapy versus DESI2 or IP10 monotherapy (##P < 0.01). (C) Frozen tumor sections from the mice treated with 5% GS, pVITRO2, pDESI2, pIP10, and pDESI2/IP10 are used to analyze the tumor angiogenesis by immunofluorescence staining with anti-CD31 antibody. Representative images of CD31 staining sections of CT26 tumor tissues were shown. (D) Microvessels in CT26 and LL2 tumor sections were counted in blindly chosen random fields to record microvessel density (MVD). Significant difference in MVD for tumors treated with IP10 or DESI2 versus 5% GS and pVITRO2 controls (**P < 0.01; ***P < 0.001); significant difference for tumors treated with pDESI2/IP10 versus 5% GS and pVITRO2 controls (**P < 0.01; ***P < 0.001); and significant difference for the combination therapy versus DESI2 or IP10 monotherapy (##P < 0.01). (E) The morphological change of immortalized HUVEC cells. The cells were untreated or transfected with pVITRO2, pDESI2, pIP10, and pDESI2/IP10 plasmids for 48 h, then used for photograph by a microscope. (F) Co-expression of DESI2 and IP10 resulted in significantly proliferation inhibition of immortalized HUVEC cells. The immortalized HUVEC cells were treated as the same condition described in E, then used for MTT assay. The MTT assay was carried out as described in Materials and Methods. Statistically significant differences compared with the two control groups (**P < 0.01) and the two single-treatment groups (##P < 0.01). Percentage of survival was calculated. Bars, SD; columns, mean (n = 3). In each experiment, the medium-only treatment (untreated) indicates 100% cell viability. (G) Co-expression of DESI2 and IP10 resulted in cleavage of caspase-3. The immortalized HUVEC cells were subjected to the indicated treatments as described in E. Caspase activation was analyzed by western blotting. β-actin was used as a loading control.