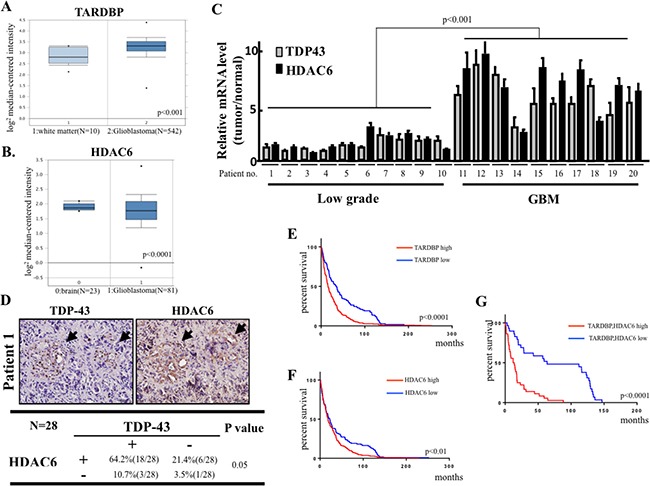
Figure 6. Clinical significance of TDP-43/HDAC6 protein expression and survival of human brain tumors patients.

(A) Box plot showing expression of TDP-43 (TARDBP) mRNA in TCGA microarray dataset consisting of white matter (normal, N = 10) and GBM (N = 542) samples. (B) Microarray data for HDAC gene expression from Sun Brian dataset consisting of normal, N = 23) and GBM (N = 81) samples. (C) The total RNA from 10 low-grade glioma and 10 GBM high-grade tumors was analyzed for TDP-43 and HDAC6 mRNA expression by quantitative real-time PCR. (D) The protein expression of TDP-43 and HDAC6 was analyzed by immunohistochemical (IHC) staining analysis in GBM tumor samples. Chi-square test was used for statistical analysis. (E) The Kaplan-Meier survival curve for brain tumor patients with differential TDP-43 (TARDBP) expression according to Rembrandt database (TARDBP high, N = 327, TARDBP low, N = 110). (F) The Kaplan-Meier survival curve for brain tumor patients with differential HDAC6 expression according to Rembrandt database (HDAC6 high, N = 327, HDAC6 low, N = 110). (G) Kaplan-Meier analysis of the survival in TARDBP and HDAC6 co-expression in brain tumor patients (TAARDBP/HDAC6 high, N = 29, TARDBP/HDAC6 low, N = 36).
