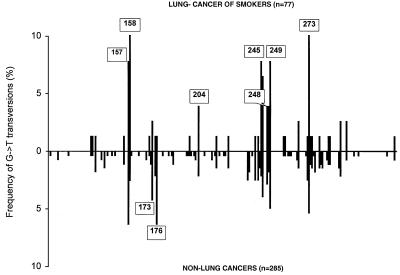
Figure 2.
Comparison of the p53 spectra of G→T transversions from lung cancer (cases related to radon and other occupational exposures excluded) of ever smokers and cancers in non-lung tissues least accessible to smoke (see Table 1). The size of the bars represents the G→T frequency at the corresponding guanine. Hot- and “warm”-spot codons are indicated.

