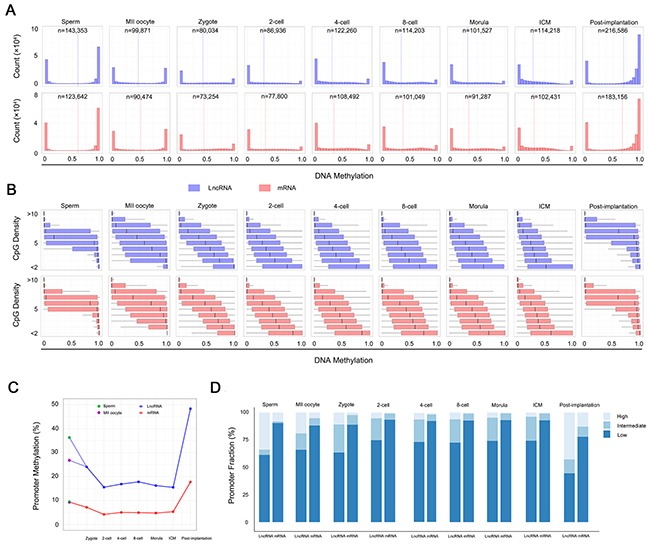
Figure 1. DNA methylation features of lncRNA genes during human PED.

(A) DNA methylation of lncRNA and protein-coding genes across 100-bp tiles for each developmental stage. Dashed line highlights the average. n equals the total number of the 100-bp tiles for a given stage. (B) Boxplots of methylation at different local CpG densities (y axis). (C) Promoter methylation of lncRNA and protein-coding genes across each developmental stage. Blue, lncRNA genes. Red, protein-coding genes. (D) Histogram of promoter fractions of 100-bp tiles with three different methylation status across different developmental stages. The tiles were divided into three status based on the methylation level: high (> 80%), intermediate (20% - 80%) and low (< 20%).
