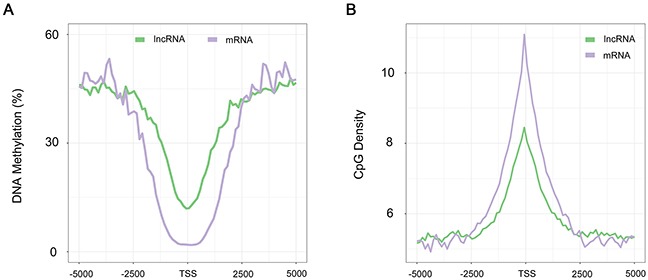
Figure 2. DNA methylation patterns around the TSS of lncRNA genes.

(A) Distribution of the methylation level calculated in 100-bp sliding windows, 5-kb up- and downstream from the TSS in sperm. (B) Distribution of CpG densities across the TSS of lncRNA and protein-coding genes. Green, lncRNA. Purple, protein-coding genes.
