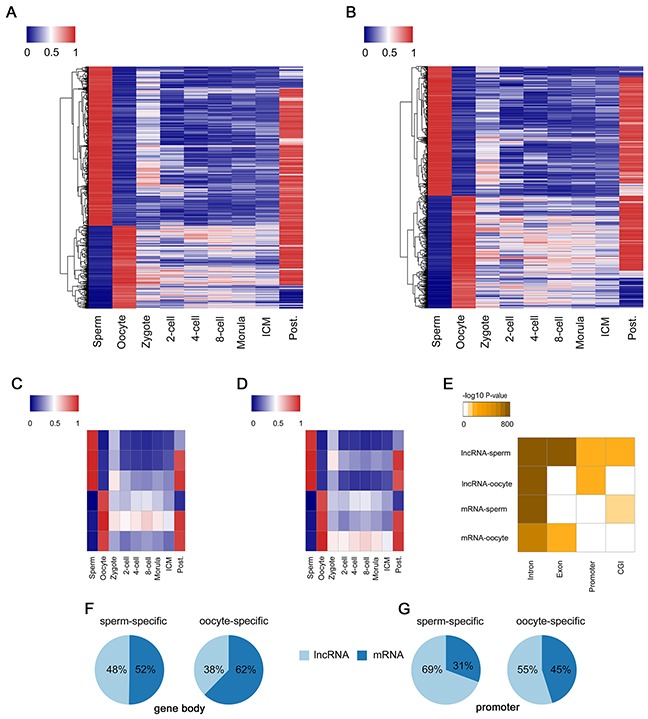
Figure 4. Identification of G-DMRs in lncRNA and protein-coding genes.

(A) Heat map of the methylation level of G-DMRs in lncRNA across each developmental stages. (B) The same in (A) of protein-coding genes. (C) G-DMRs in lncRNA regions are clustered via k-means into 6 dynamics. (D) The same in (C) of protein-coding genes. (E) The hypergeometric enrichment analysis of different G-DMRs including sperm-specific DMRs in lncRNA (lncRNA-sperm), lncRNA-oocyte, mRNA-sperm and mRNA-oocyte for intronic, exonic, promoter or CGI annotations, which indicates the different methylation features of G-DMRs between lncRNA and protein-coding genes. (F) The ratio of lncRNA and protein-coding genes in sperm-specific or oocyte-specific DMRs among gene body regions. (G) The ratio of lncRNA and protein-coding genes in sperm-specific or oocyte-specific DMR among promoter regions.
