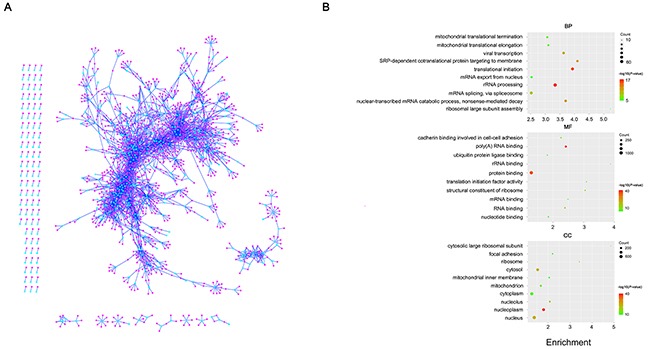
Figure 6. The coding-non-coding gene co-expression network.

(A) Visualization of the CNC network. Cyan nodes represent lncRNA genes while pink nodes represent protein-coding genes. (B) Function enrichment analysis result of protein-coding genes in the CNC network. The colors indicate the significance (-log10 transferred P-value), and the circle size represent the number of genes enriching the corresponding annotation. The fold enrichment of analysis are shown in horizontal axis. Top, “biological process” term. Middle, “molecular function” term. Bottom, “cellular component” term.
