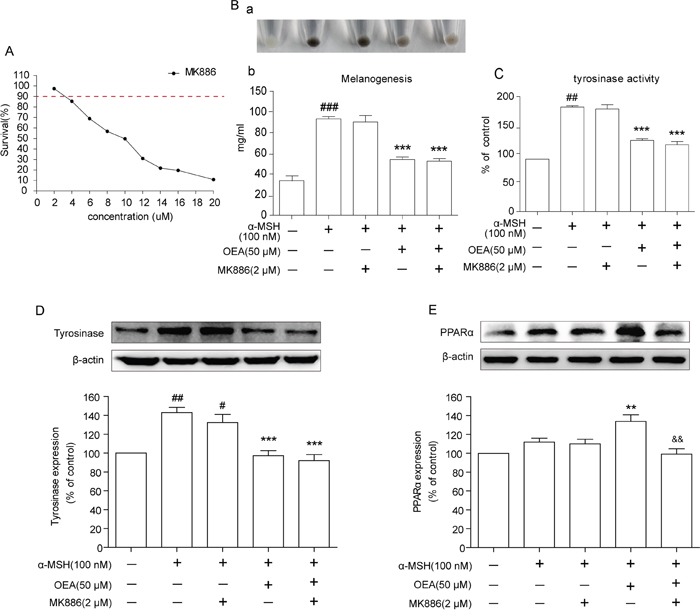
Figure 3. Effects of OEA on the PPARα signaling in α-MSH-stimulated B16 cells.

(A) Cells were treated with various concentrations of MK886 for 72 h. B16 cells were pretreated with DMSO only or MK886 (2 μmol/L) for 1 h followed by the addition of 100 nM α-MSH in the absence or in the presence of 50 μM OEA. (B) Relative melanin content and (C) tyrosinase activity were measured, and (D and E) the cell lysates were isolated through Western blot at 72 h after OEA treatment. The data are presented as percentages compared with the control group (set to 100%) and represented as the means ± SEM of three separate experiments performed in duplicate (n=3). #P<0.05, ##P<0.01, ###P<0.001 vs. control group; *P<0.01, ***P<0.001 vs. α-MSH-stimulated group; &&P<0.01 vs. α-MSH+OEA group.
