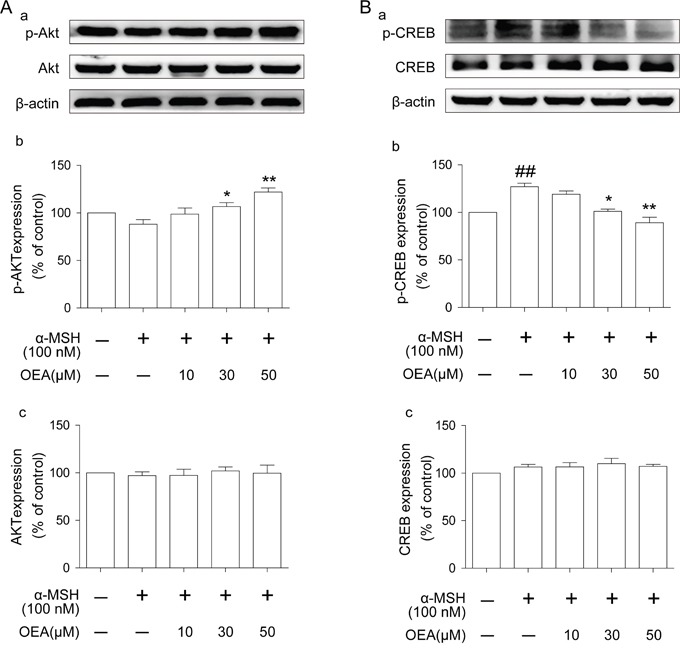
Figure 5. Effect of OEA on Akt and CREB signaling pathways in α-MSH-stimulated cells.

(A-a and B-a) The protein levels of p-Akt, Akt, p-CREB, and CREB were examined by Western blot. (A-b, A-c, B-b, and B-c) The data are presented as percentages compared with the control group (set to 100%) and represented as the means ± SEM of three separate experiments performed in duplicate (n=3). ##P<0.01 vs. control group; *P<0.05, *P<0.01 vs. α-MSH-stimulated group.
