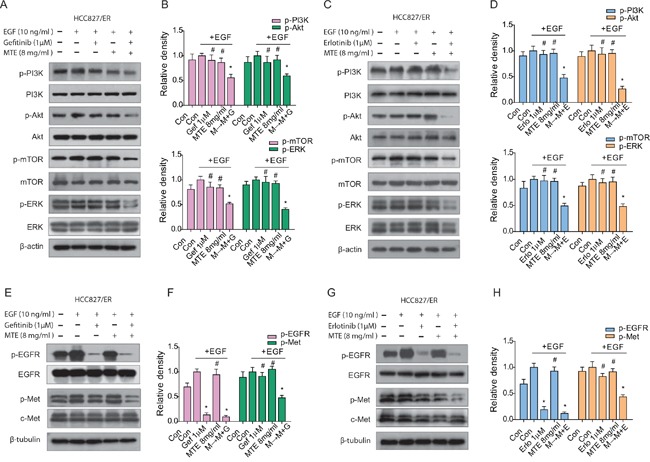
Figure 3. Effect of combined treatment of erlotinib or gefitinib with MTE on EGFR-related downstream molecules in HCC827/ER cells.

Cells were treated with 1 μM erlotinib or gefitinib alone or in combination with 8 mg/ml MTE (M→M+E for erlotinib, M→M+G for gefitinib) for 24 hours. Cells were stimulated with 10 ng/ml EGF for 15 min before harvest. Cell lysates were collected and subjected to SDS-PAGE and Western blotting, analyzed with phospho-specific antibodies to PI3K/Akt/mTOR, ERK1/2 (A for gefitinib, C for erlotinib), EGFR and c-Met (E for gefitinib, G for erlotinib). (B and D) are quantification of (A and C), (F and H) are quantification of (E and G), respectively. Each bar represents mean ± SD of three separate experiments. *p < 0.05 vs control group, #p < 0.05 vs combinations of erlotinib or gefitinib with MTE. Con: control; Gef: gefitinib; Erlo: erlotinib; MTE: M. tenacissima extract; EGF: epidermal growth factor.
