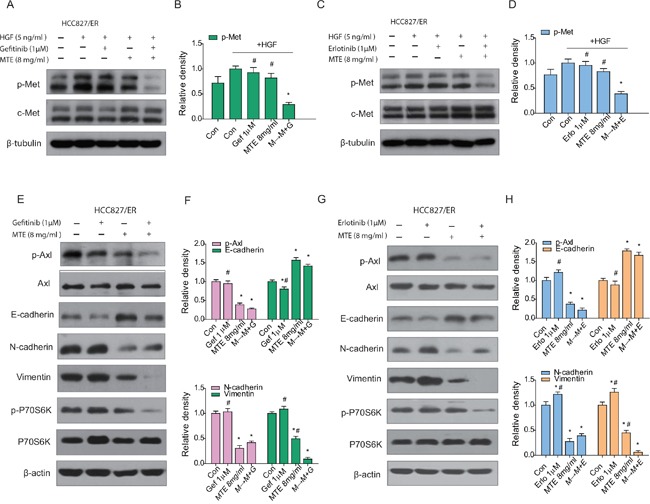
Figure 4. Effect of combined treatment of erlotinib or gefitinib with MTE on EGFR bypass signaling in HCC827/ER cells.

Cells were treated with 1 μM erlotinib and gefitinib alone or in combination with 8 mg/ml MTE (M→M+E for erlotinib, M→M+G fore gefitinib) for 24 hours. To determine the expression profile of p-Met, cells were stimulated with 10 ng/ml HGF for 5 min before harvest (A-D). Cells harvested for detection of other bypass signals were not stimulated with HGF (E-H). Cell lysates were collected and subjected to SDS-PAGE and Western blotting, analyzed with phospho-specific antibodies to p-Met (A for gefitinib, C for erlotinib), p-Axl, E-cadherin, N-cadherin, vimentin and p-P70S6K (E for gefitinib, G for erlotinib). (B and D) are quantification of the results in (A and C), and (F and H) are quantification of (E and G). Each bar represents mean ± SD of three separate experiments. *p < 0.05 vs control group, #p < 0.05 vs combinations of erlotinib or gefitinib with MTE. Con: control; Gef: gefitinib; Erlo: erlotinib; MTE: M. tenacissima extract; HGF: hepatocyte growth factor.
