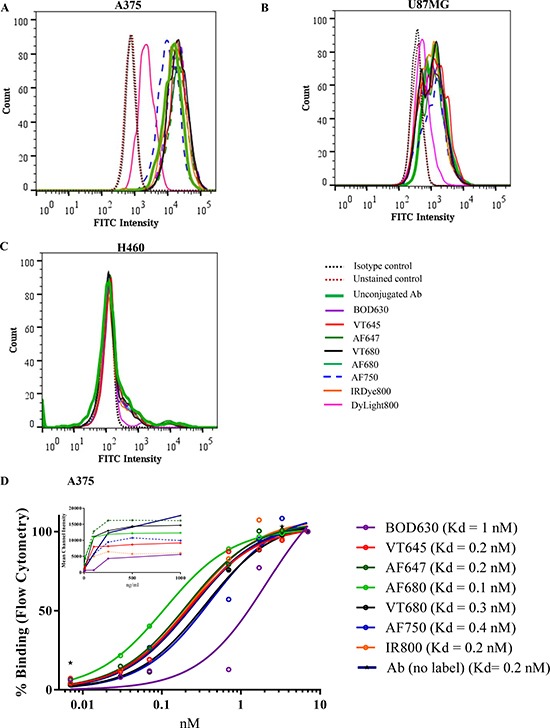
Figure 2. Cell binding assay.

The cell binding ability of Ab-F conjugates was assessed by flow cytometry in (A) A375, (B) U87MG, (C) H460 cell lines. The cells were incubated with different Ab-F conjugates or unlabeled Ab, followed by detection with a FITC-conjugated secondary Ab. Cells incubated with an isotype control Ab were used as the negative control (Isotype control), cells incubated with unlabeled Ab were used as the reference standard (unconjugated Ab) and cells that were not labeled with any Ab were used as the unstained control. The peak shifts after labeling with detection Ab (FITC-conjugated secondary antibody) was compared among treatments. The histogram for the DyLight800-conjugated Ab showed a peak shift from that of the unconjugated Ab in A375 and U87MG cells. All other Ab-F conjugates showed a peak shift similar to the unconjugated Ab and thus the histograms overlap on each other. (D) Receptor binding of IL13Rα2 Ab conjugated to different fluorophores to A375 cells. All Ab-F conjugates showed highest binding at ∼100–200 ng/mL Ab concentration. All experiments were performed in triplicates and repeated two times.
