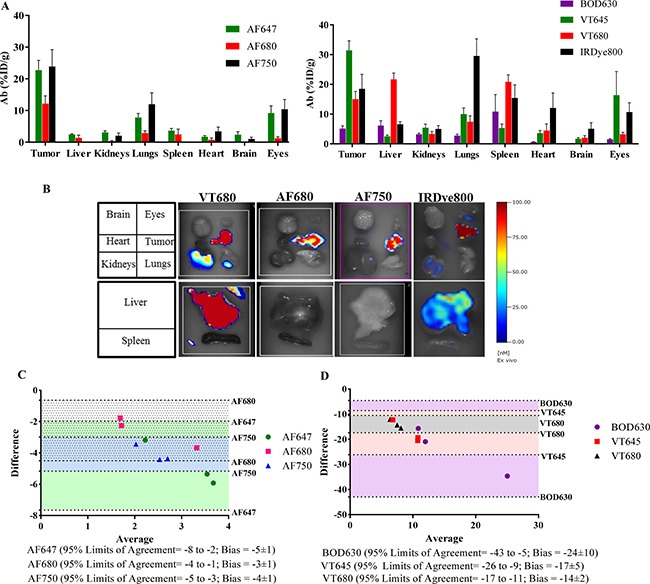
Figure 5. Comparison of ex vivo FMT imaging and LBA quantitation.

Ex vivo FMT imaging was performed at 96 h on selected organs collected after whole-body perfusion. (A) Ab uptake in terms of %ID/g for organs from various Ab-F groups. (B) Representative images for organs (brain, eyes, heart, tumor, kidneys, lungs, liver and spleen) from the Ab-VT680, Ab-AF680, Ab-AF750 and Ab-IRDye800 groups. (C) And (D) Bland-Altman plot for comparison of quantitative values obtained from FMT and LBA for the tumor. The Ab-F conjugated to AF647, AF680 and AF750 showed narrow limits of agreement (95%) and lower bias (C), whereas Ab-F conjugated to BOD630, VT645 and VT680 showed wider limits of agreement (95%) and higher bias. n = 3–4/group, with ± SEM as error bars.
