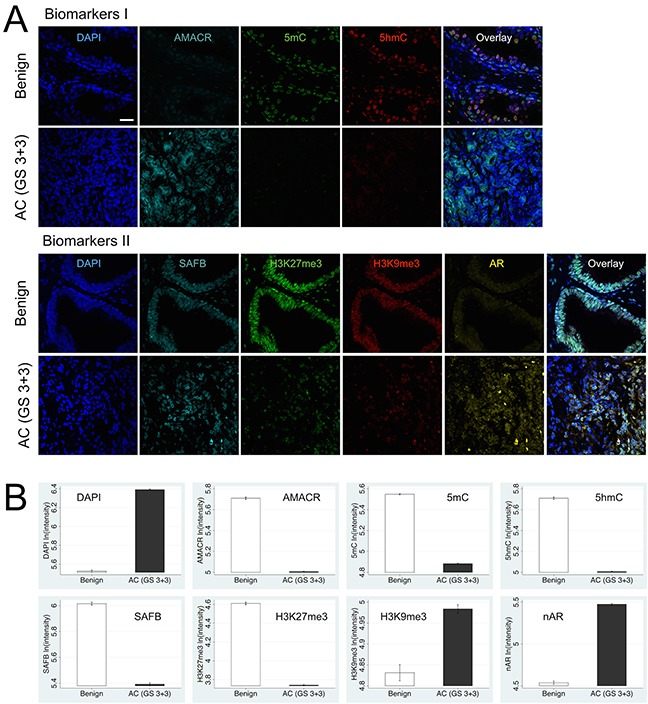
Figure 2.

Differential levels and cellular heterogeneity of Biomarkers I and II between biopsied benign and cancerous prostatic tissues (represented by AC with GS6), as visualized by confocal scanning microscopy (A). Each marker (false-colored) was recorded in a separate channel. For each tissue sample all channels —including the multi-color overlay image— are presented as maximum intensity projections. (B) Quantitative presentation of biomarker levels as bar plots indicate for Biomarkers I: significant increase in DNA content (DAPI) and AMACR levels and simultaneous loss of the two epigenetic DNA modifications 5mC and 5hmC in both basal and luminal epithelial cells in AC versus benign tissue; luminal cells seemingly exhibit a stronger loss of 5hmC compared to basal cells. Biomarkers II: concurrent loss of suppressive chromatin-state marker H3K27me3 and decrease of chromatin-associated SAFB levels, while H3K9me3 and nuclear AR levels are highly elevated in AC versus benign tissue. Scale bar is 10 μm.
