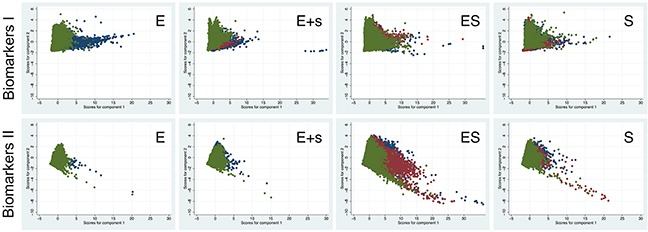
Figure 3. Comparative tissue compartment-specific results of principle component analysis (with two components) for Biomarkers I and II.

The data was separated into subsets representing the first biopsy (blue), the second biopsy (red), and finally prostatectomy (green). Each dot represents one cell. The results show a high overlap when epithelial and stromal compartments are analyzed together (ES). The overlap is reduced in the case of only a minor involvement of stroma (E+s). The best segregation is seen when the epithelial compartment is analyzed by itself, indicating the highest change (variance) for the analyzed markers. The latter subdata is missing data from two biopsies, as most patients for which epithelial (E) compartments could be analyzed were initially diagnosed with lots of AC and thus only underwent one biopsy prior to prostatectomy.
