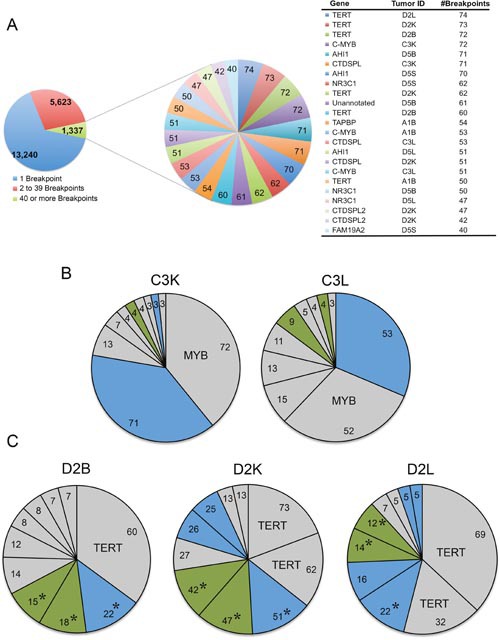
Figure 2. Viral integrations into CTDSPL and CTDSPL2 are an early event in tumorigenesis.

(A) A composite pie chart of 11 tumors containing clonally expanded integrations in either CTDSPL or CTDSPL2 is shown. In this tumor set, there were 14,879 unique integrations represented by 20,200 total breakpoints. Integrations having 40 or more breakpoints are depicted in a separate composite pie chart with individual integrations as a single “slice” of the pie chart, weighted by number of breakpoints. There are 23 integrations with 40 or more breakpoints. Of these top clonally expanded integrations, 3 are in CTDSPL and 2 are in CTDSPL2. (B) CTDSPL and CTDSPL2 are dominant integrations in some individual tumors. The top 10 clonally expanded integrations are shown for representative tumors (C3L and C3K). In these cases CTDSPL and CTDSPL2 are among the most dominant integrations. CTDSPL integrations are indicated in blue, CTDSPL2 integrations are indicated in green. Top integrations are labeled. (C) Primary (bursa) and secondary (kidney and liver) tumors from the same bird (D2) have identical integrations in CTDSPL and CTDSPL2. CTDSPL integrations are indicated in blue, CTDSPL2 integrations are indicated in green. The most dominant integrations are labeled. Identical integrations in each tumor are indicated with *. These integrations are clonally expanded in all cases, comprising a comparable proportion of the total tumor breakpoints. This suggests that these integrations occurred early in tumorigenesis, within the bursa and subsequently metastasized to these secondary sites.
