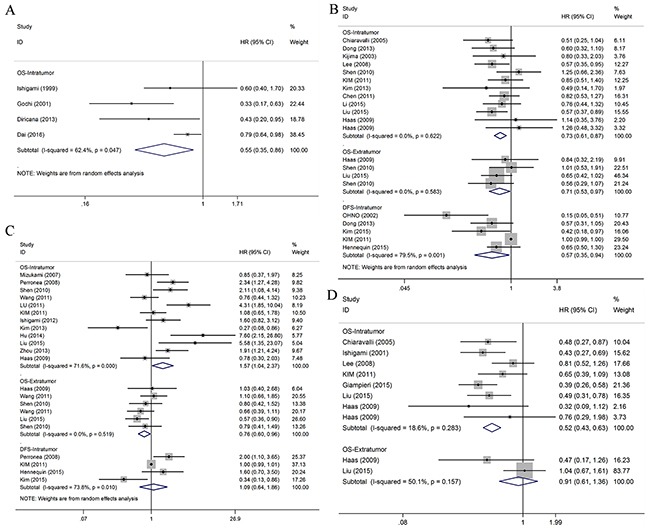
Figure 2. Forest plots of studies evaluating hazard ratios of high level of TILs subsets in gastric cancer by the distribution.

(A) Forest plot for the prognostic effect of general TILs. (B) Forest plot for the prognostic effect of CD8+ T cells. (C) Forest plot for the prognostic effect of FOXP3+ T cells. (D) Forest plot for the prognostic effect of CD3+ T cells.
